Nifty Volume profile, Why we can pause near 17350!
Aug 01, 2022
Like this Article? Share it with your friends!
Nifty has continued to be Buy on Dips that we have been mentioning over past entire week. It has paid out well especially if you know how to Trade Options using Volume profile and Elliott wave.
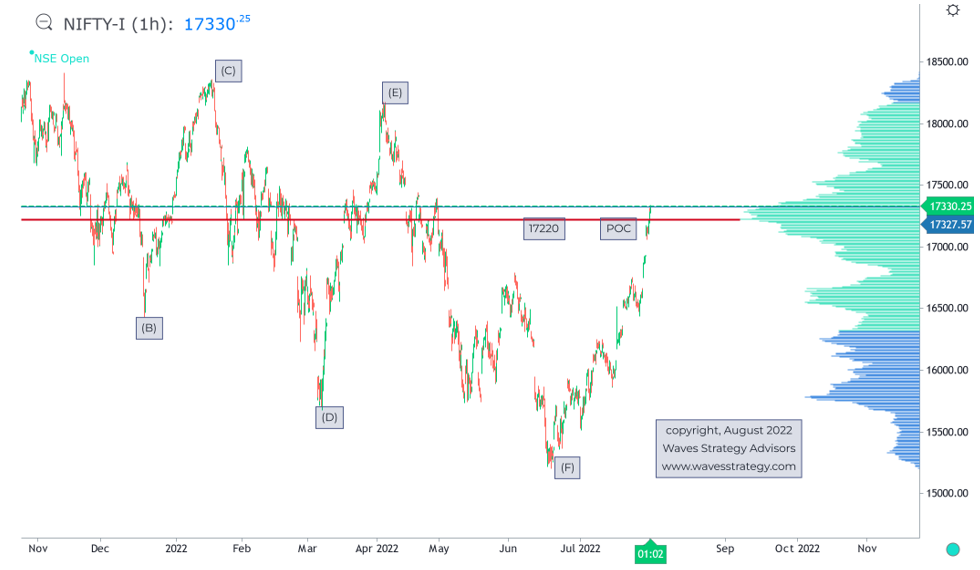
Below research shows Elliott wave pattern along with support & resistance where there is volume activity taken place. The Volume profile shows behind the scenes action when majority are focused on price action or just volume and not the profile that represents at which price point major action is taking place.
Elliott wave for Options Trading
Now by looking at the above chart, we can clearly see three important levels, 17220 - 17300 – this is the Point of Control (POC) where the highest activity has taken place which looks like major traders were trapped in this zone with smart money moving out of markets during the fall. Now that prices are back towards this level there will be some offloading by traders who were stuck and looking forward for exit. Big players accumulated near 15780 which is the highest profile within the blue zone. So there is possibly Nifty might be hitting the speed breaker now with profit booking from the big players near current levels and offloading by traders who are stuck near the zone of 17300 levels.
Elliott wave – As per the wave pattern prices are forming a Diametric pattern. Currently wave g is ongoing which is just moving near the Volume Point of Control. A sustainable close above 17350 will extend this wave g further on the upside for a move towards 17517 which is 76.4% projection of wave (G) to that of wave (A). For a retracement to start, Nifty has to now break below 17180 (futures) or 17150 levels as per spot so we know POC resistance has kicked in.
Above research clearly shows that by combining this simple method of Volume profile along with Elliott wave one can form prudent option trading strategy, possibly of selling OTM options or selling Puts on dips to the POC near 17200 levels as market can be in sideways to positive.
Option Trading Using Technical Analysis (OTTA) along with Elliott Wave (MOW) - Learn to trade Options using Elliott wave, Volume profile, Open Interest analysis, Bollinger Bands breakout strategy, Candlesticks and much more on Techniques can be applied for Intraday / Positional Option buying and selling, Generate passive income by systematic way of trading options, derive targets, profit levels, Option strategy – know more here