Nifty 17520 Highest Traded Volume Area, Will it Halt the Move?
Apr 21, 2022
Like this Article? Share it with your friends!
Nifty has been moving sharply in either direction without any meaningful trend. During such times it is important to see price action reversal areas where there has been high volume nodes.
For this we use Volume profile to see the place where maximum traded volume has taken place at a specific price point. Volume profile is different than Volumes / OI that we usually observe.
Nifty Volume profile chart:
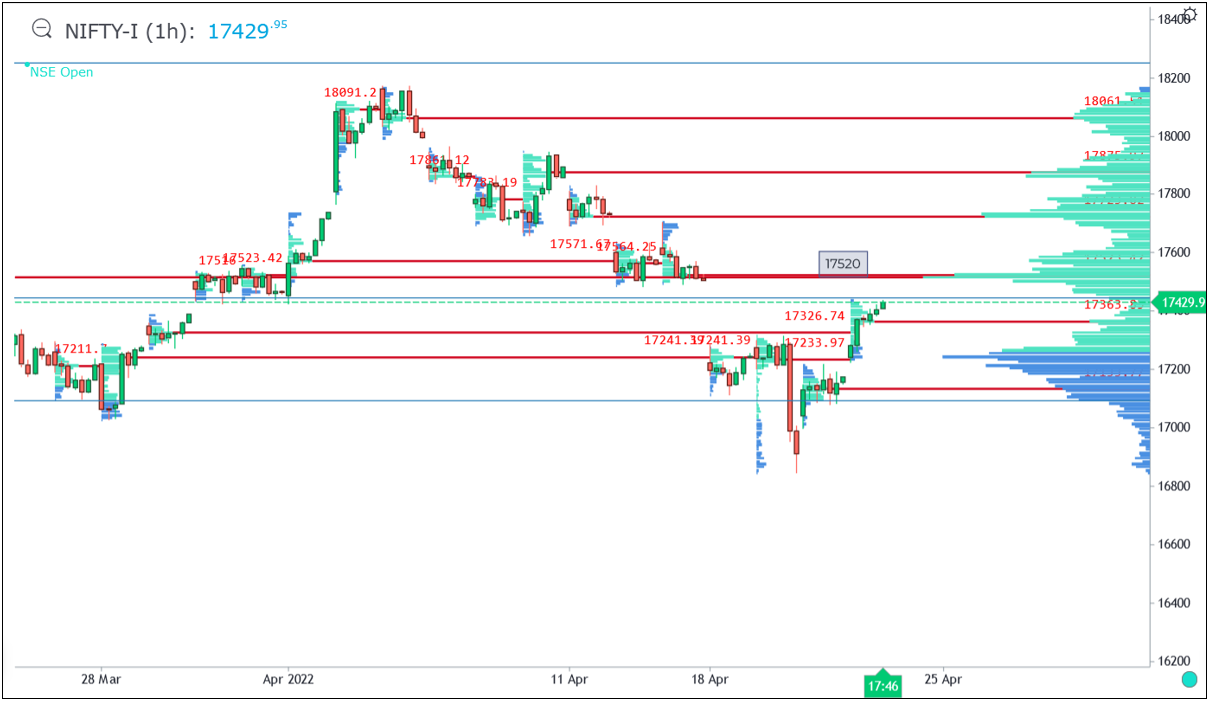
Above chart clearly shows that 17520 is the area where maximum volumes have taken place. This we also call as Volume Point of Control (VPOC). This represents that some activity by big players have taken place there.
We can clearly see that the crash seen on 19th April on downside was due to lack of participation or volumes and so it was unreliable. Volume plays vital role in understanding if the breakout is genuine and if big players are participating.
Before the rise seen today, there was accumulation near 17120 levels which was acting like a magnet. So, crossing above 17520 will require strong hands and will not be easy to take out unless there is a Gap.
Any reversal from the zone of 17520 might give opportunity to call sellers for short term as then consolidation can be expected.
In a nutshell, by simply looking at price action reversal areas is not ideal way to see things but if volumes are huge at a particular price action area it will make all the more sense to take positions.
Learn the science of applying this volume profile along with Open Interest analysis, Option chain, Breakout trade setups, Expiry day trades and much more in upcoming training in 2 days 23rd – 24th April on Options Trading Using Technical Analysis (OTTA). Fill below form for more details: