
Nifty 50 Technical Analysis: 55-Day Time Cycle Signals a Critical Phase
Sep 17, 2026
Nifty has been moving with high volatility. After breaking below the cycle low on the daily timeframe near the 23,900 zone, prices have shown a sharp reversal.
It has now been a record 14 consecutive days where Nifty has not closed above the previous day's high. The overall undertone therefore remains on the downside unless we see a close above the prior day's high.
Yesterday's high was near 23,284, and a sustained close above this level is going to be important for indicating a change in the immediate trend.
Nifty Analysis Using Non-CAS Data
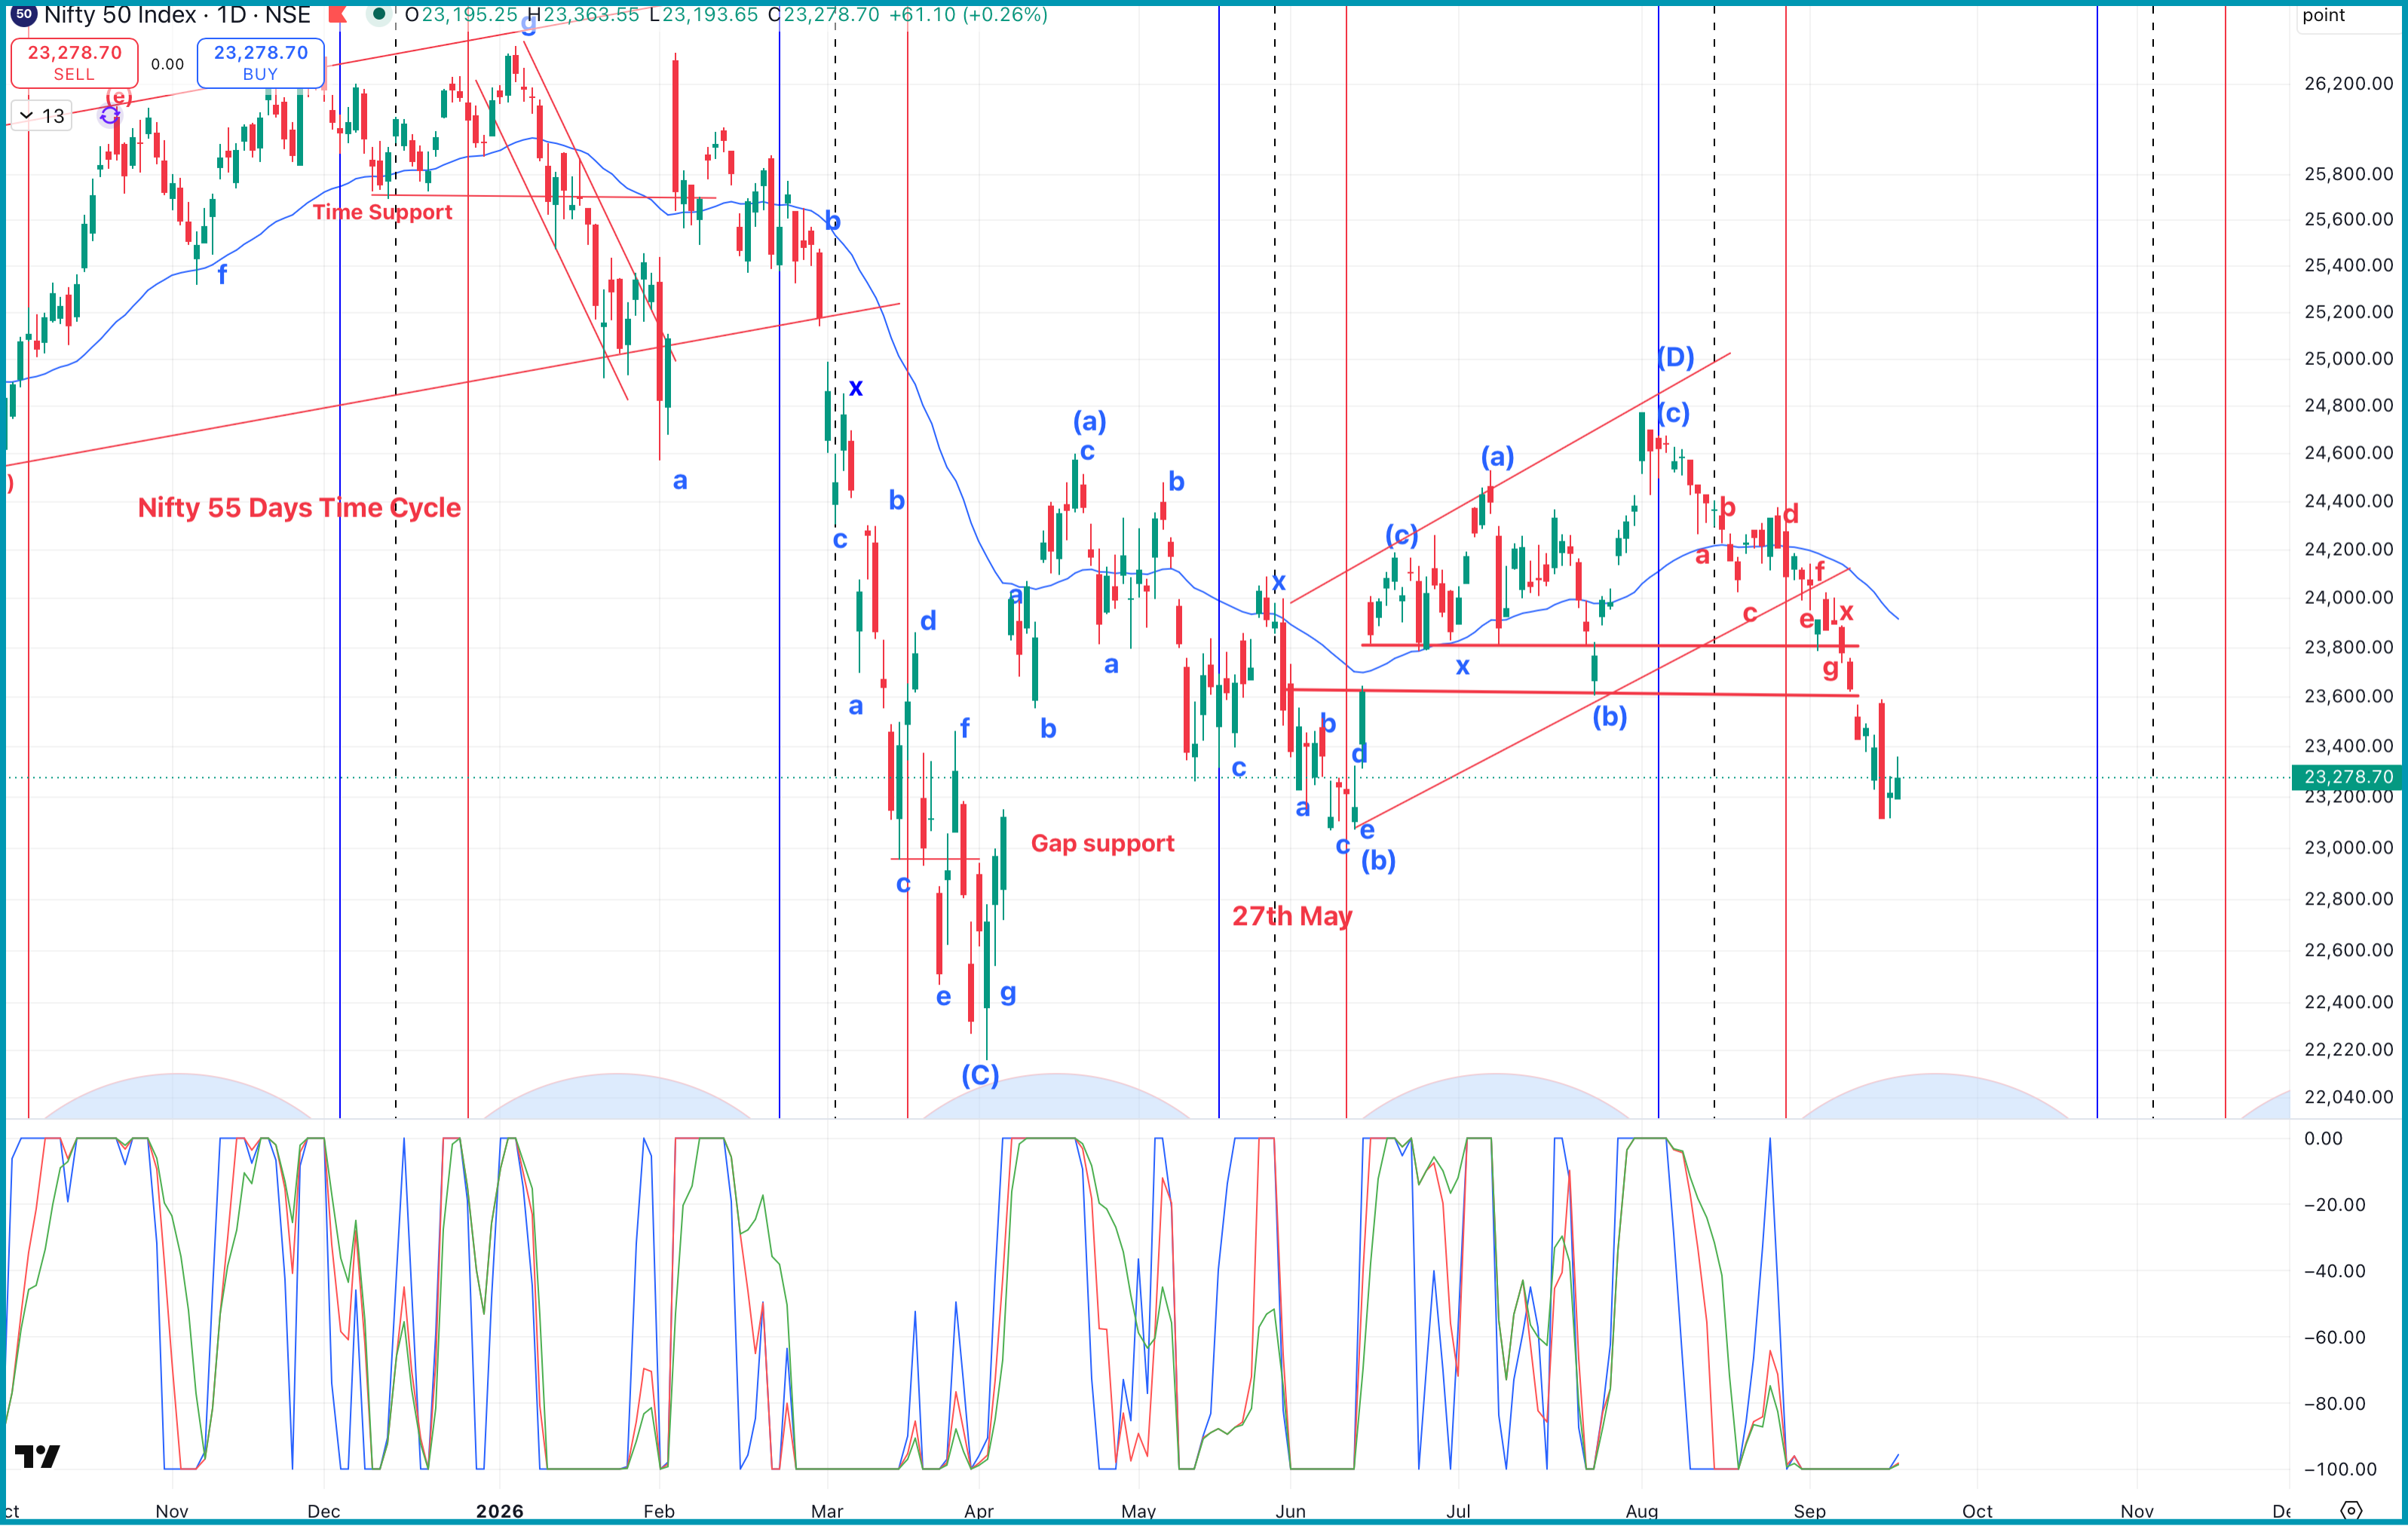
We have started taking data since the break of 24,000 on the downside, using the non-CAS data, and this approach has helped us forecast and anticipate the market movement extremely well.
Over the past few days, we have mentioned that a short strangle strategy could work well because options implied volatility has remained high. This strategy has worked out very well in the recent market conditions.
As shown on the Nifty daily timeframe chart, prices are moving down in the form of Wave (E). The AK Indicator has also remained confirmed on the negative side since the break of the 23,900 level.
There has been an attempt on the upside today, but prices have failed to sustain above 23,380, which is the upper end of the immediate zone, and have reversed from there.
23,380 Remains an Important Zone for Nifty
In the morning tweet, we also mentioned that any reversal from the 23,380 zone could provide an opportunity for a move back towards 23,250.
The same setup has worked out extremely well, with Nifty moving back towards the projected downside zone.
Nifty 50 Hourly Chart: Channelized Downtrend
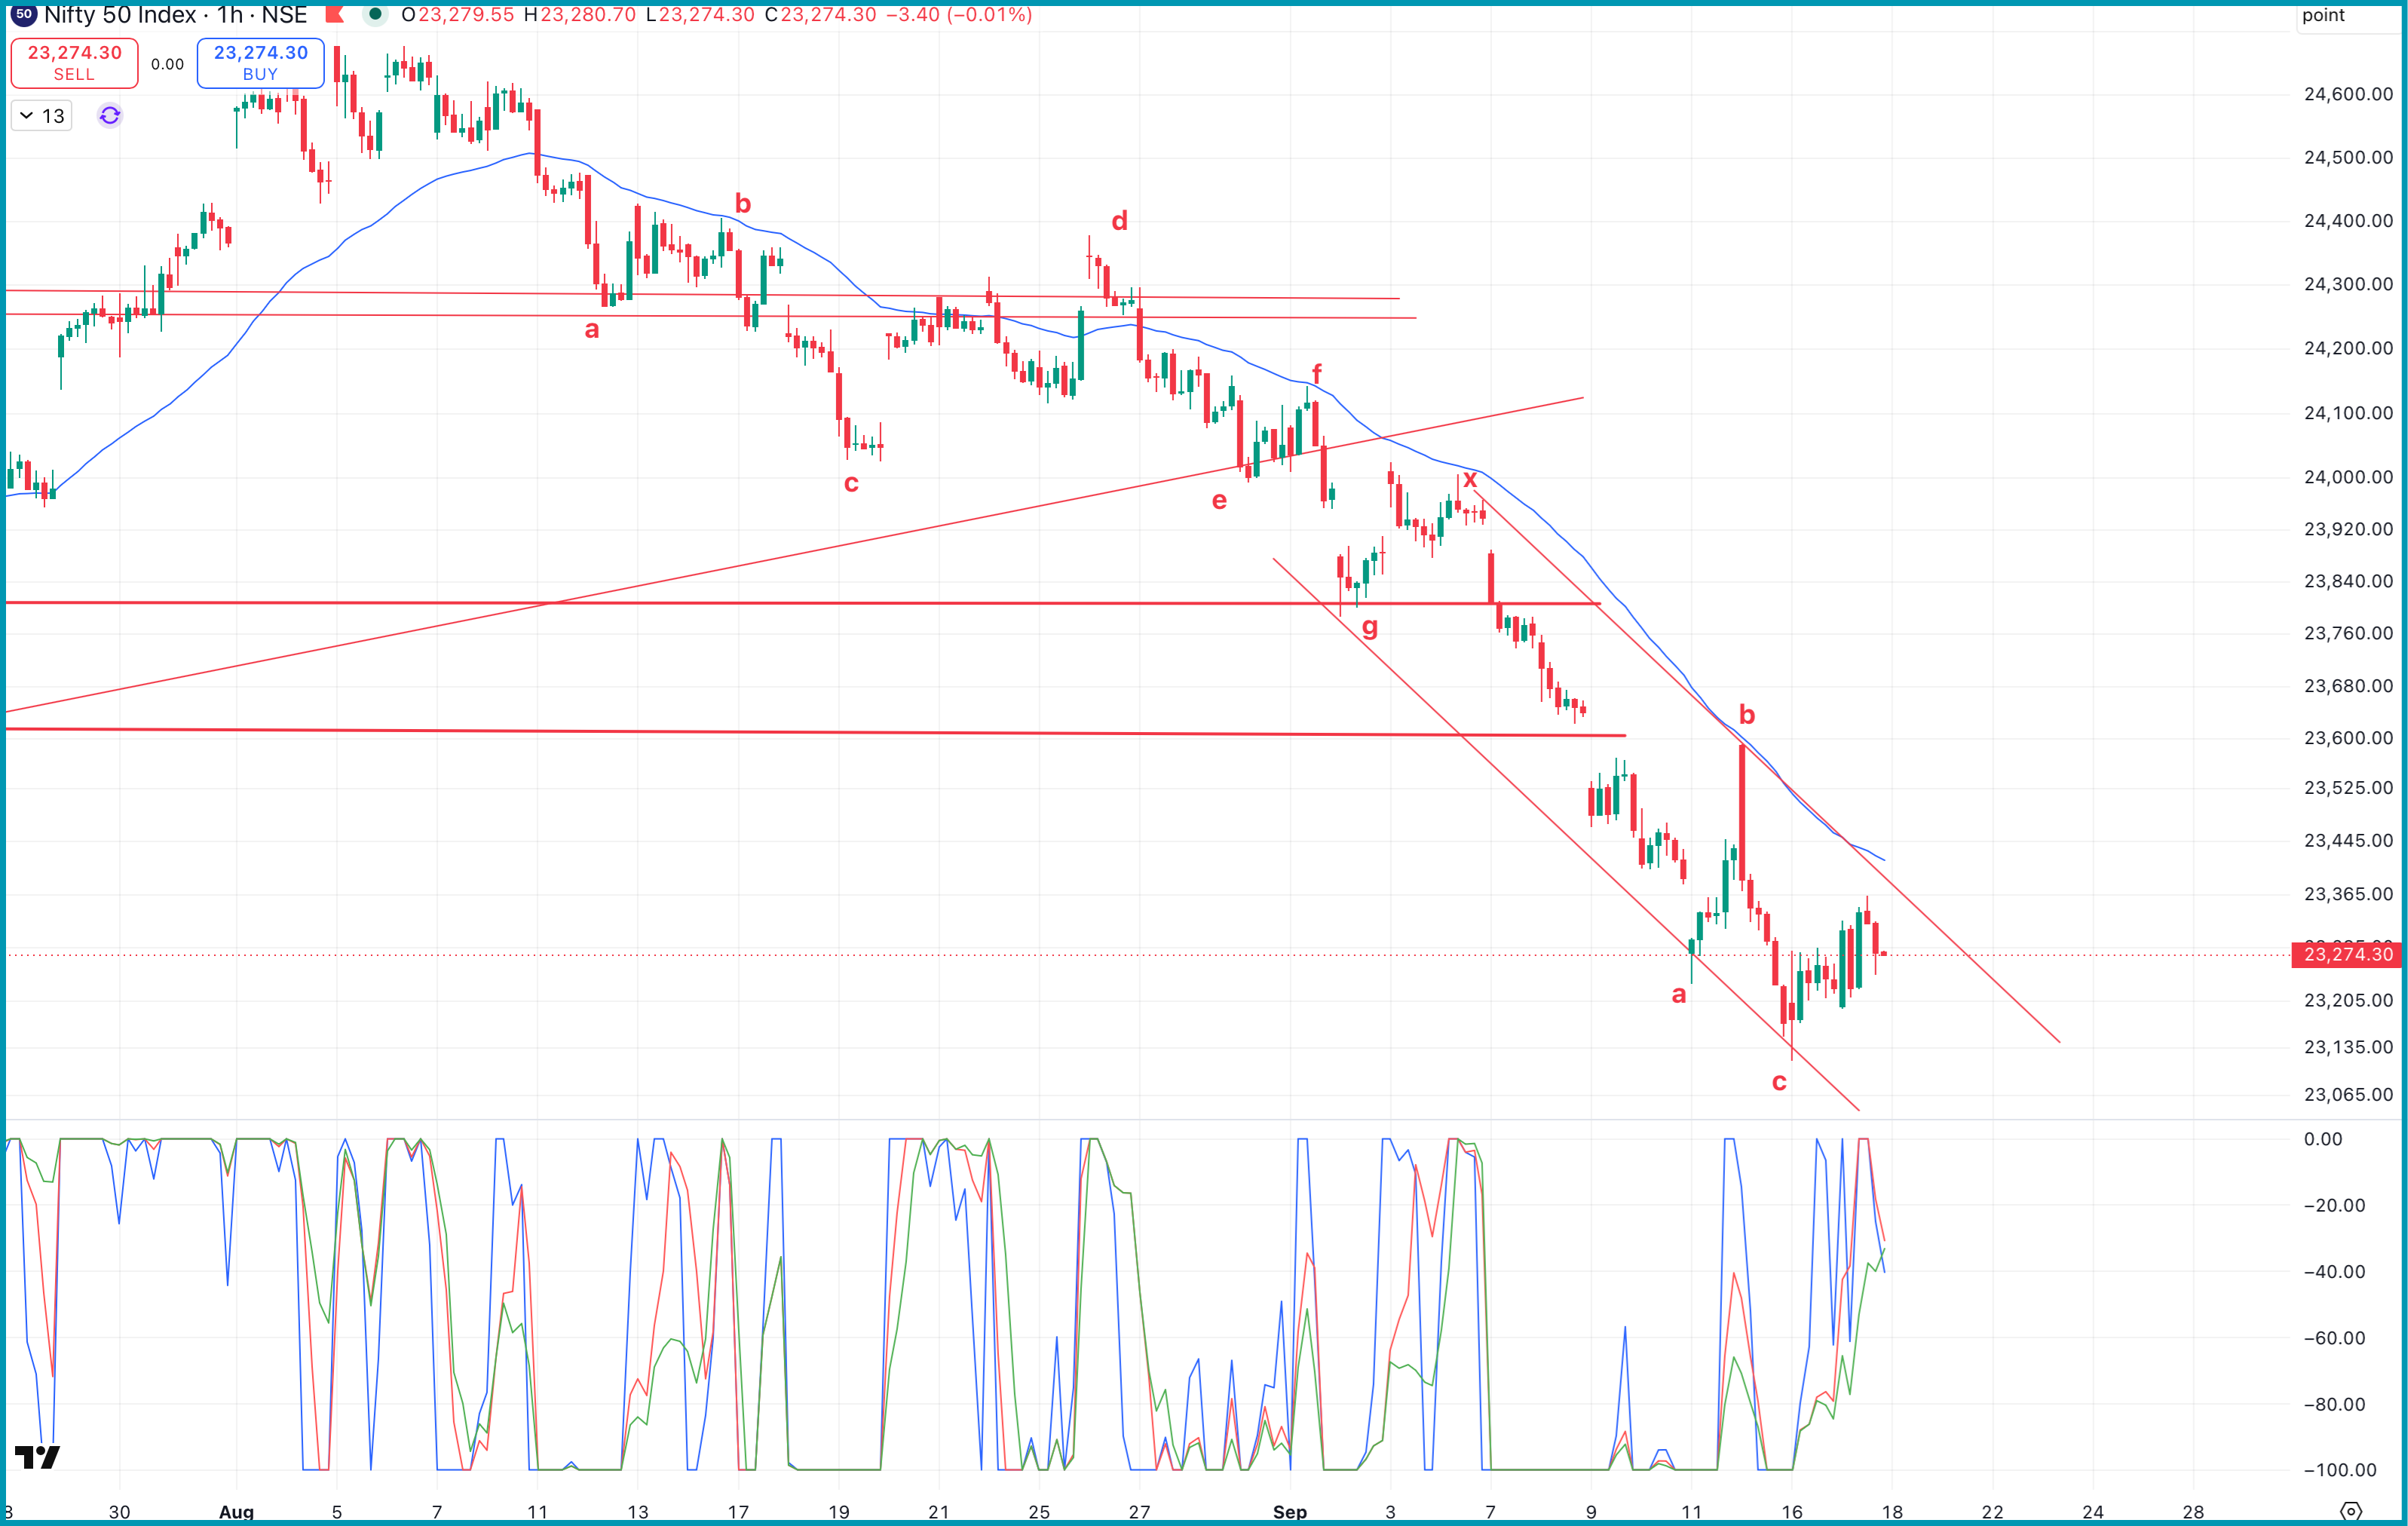
On the one-hour timeframe, we can see that prices are moving down in a channelized format and are also finding a hurdle at the 42-period moving average.
The 42-period moving average is derived using the time-cycle framework.
The AK Indicator shown below in the hourly chart shows that all three lines are deviated, which is a classic signal of non-trending behaviour.
In a non-trending environment, when implied volatility is high, a short strangle strategy can be used to participate in the market without getting overly involved in every violent intraday movement.
It is effectively like sitting out of the market and allowing the violent movement to take place within a range. This is one of the characteristics that makes a short strangle relevant in such conditions.
Elliott Wave Structure on the Hourly Chart
The overall fall on the downside appears to be developing in a complex wave structure.
After the x-wave, the fall was in the form of Wave a, followed by an upside retracement in the form of Wave b.
The recent low formed at 23,119 created a failed-breakout pattern on the downside, and prices are now moving in the form of Wave d.
The completion of this Wave d will be crucial information for determining the next chart pattern and the subsequent market structure.
Crude Oil Remains an Important Factor
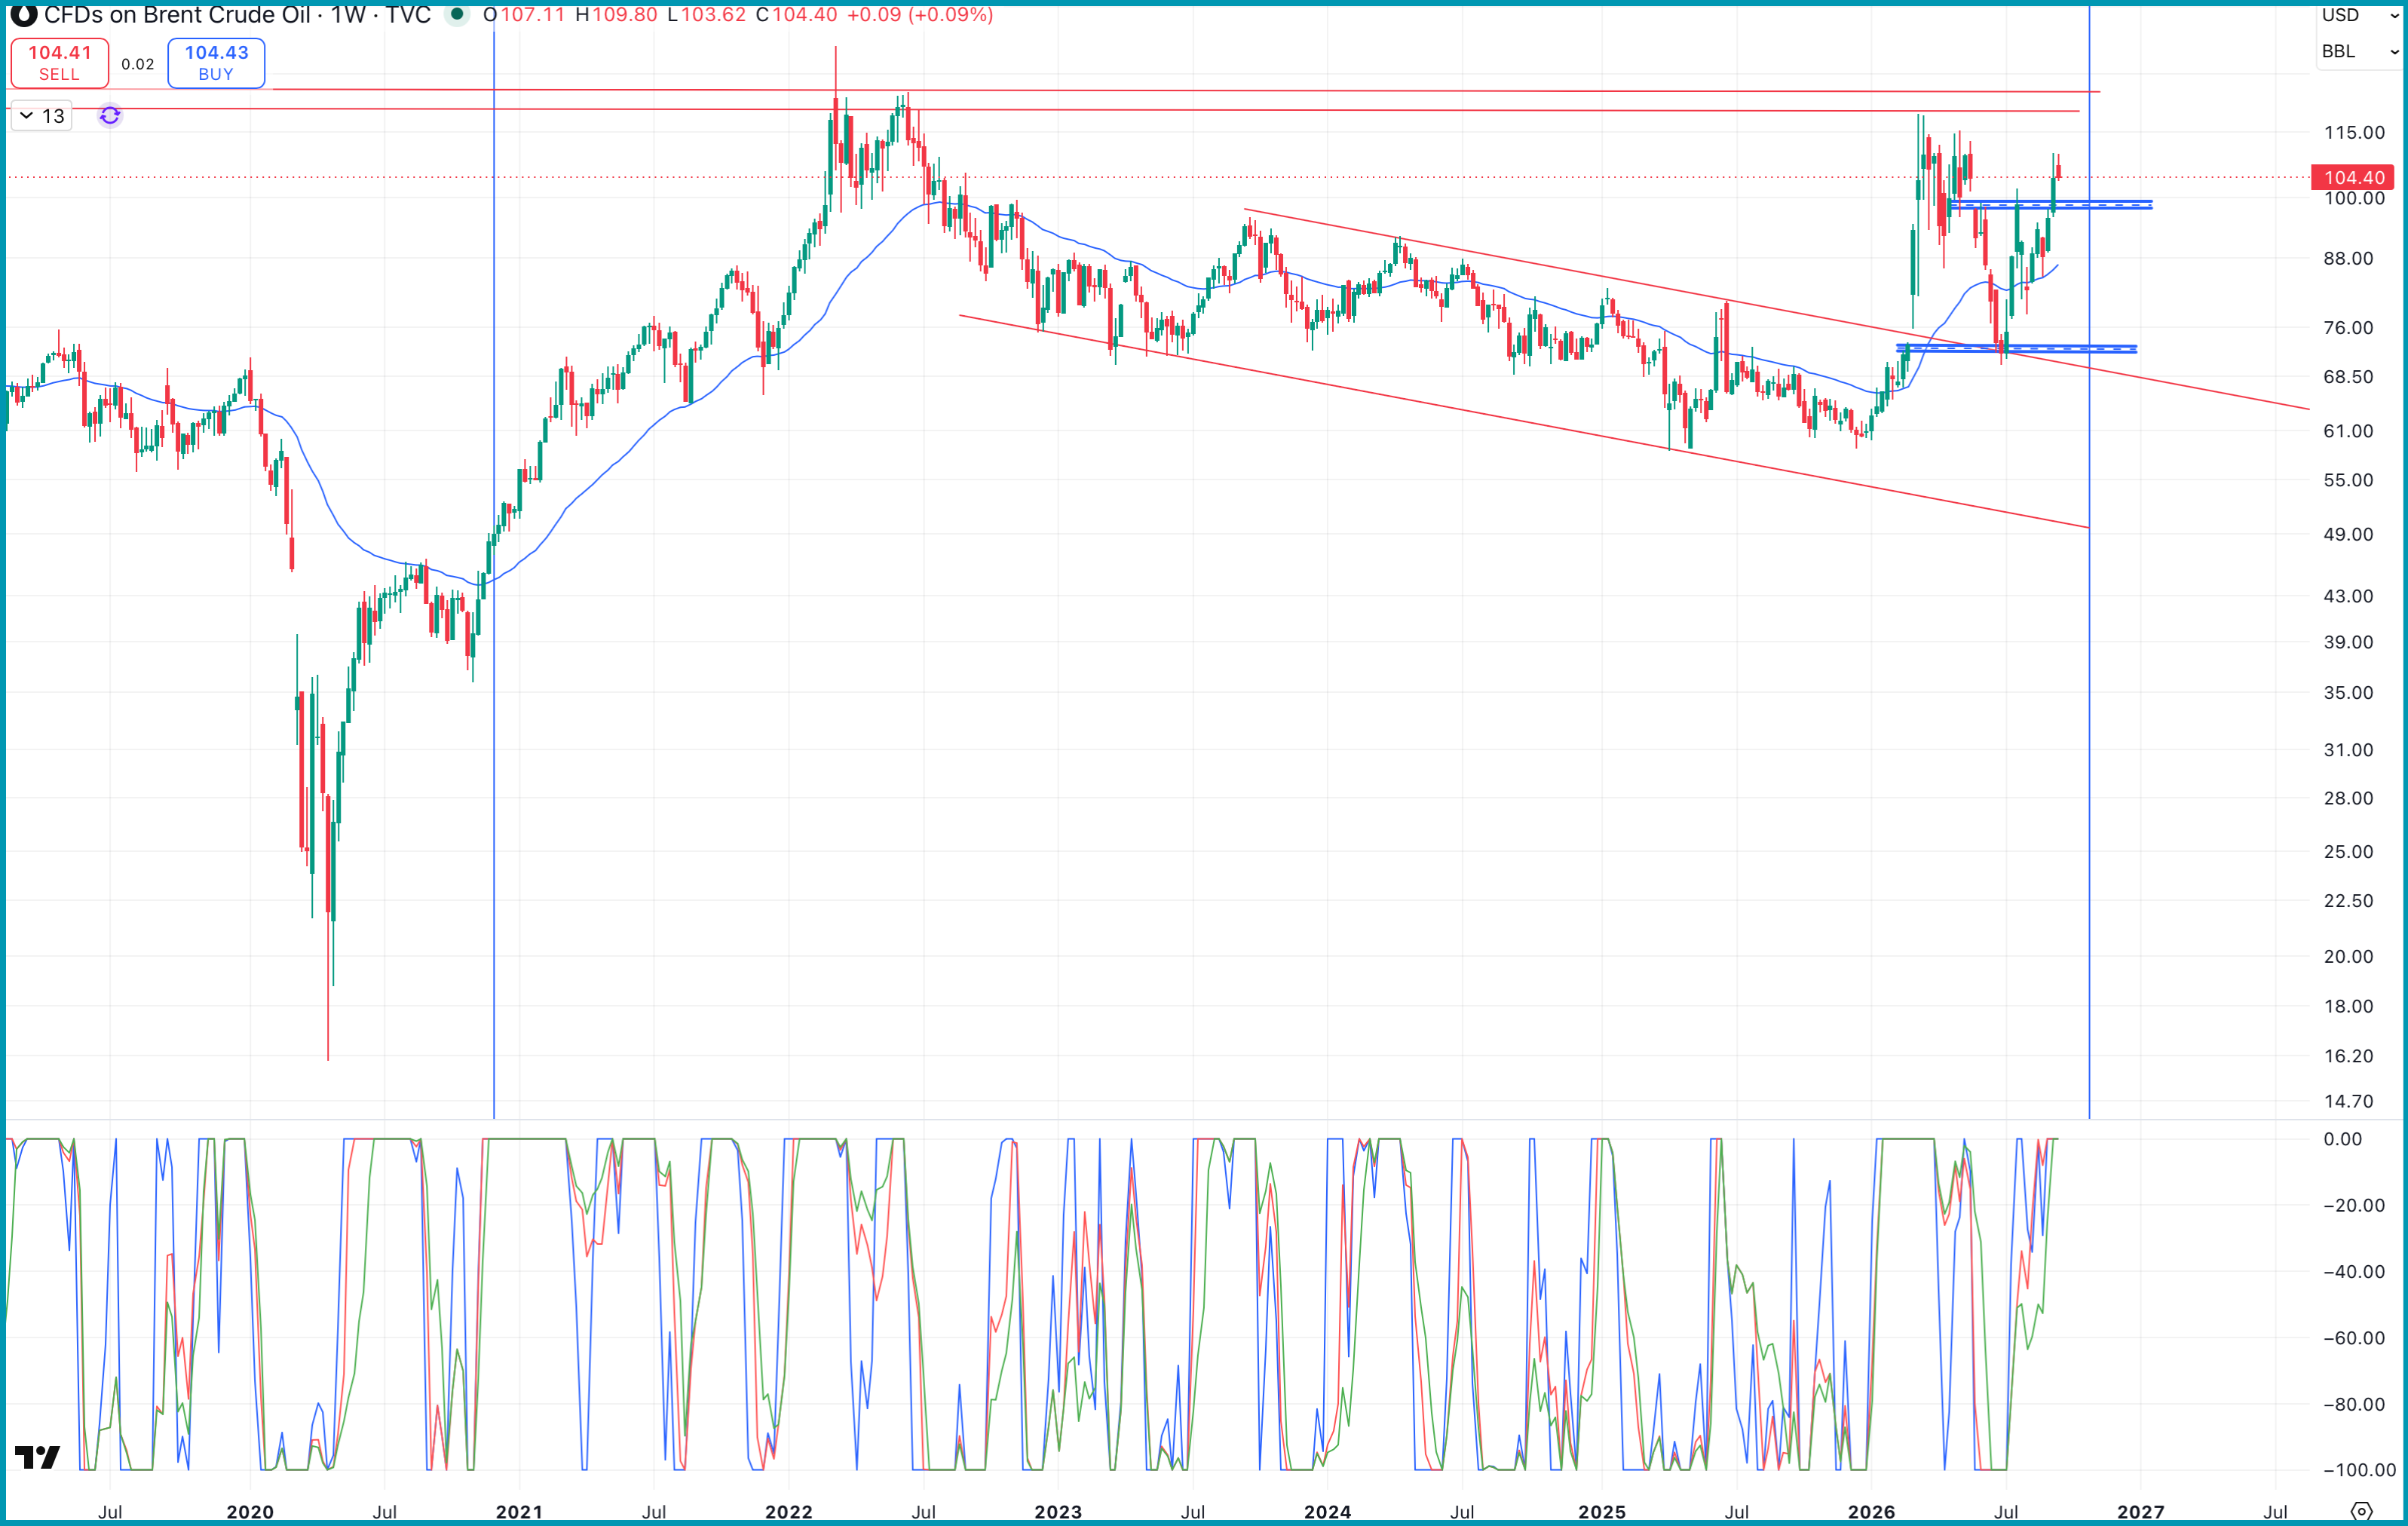
Crude oil prices have been a major factor behind the ongoing volatility in the market.
Looking at the Brent crude weekly chart, prices have shown some pullback action since yesterday. However, the major hurdle for crude oil is going to be the $120–$125 zone.
This has historically been an important reversal area, including during periods of significant geopolitical stress such as the Russia–Ukraine war and the early stages of the Israel–Iran conflict.
Therefore, crude oil remains an important variable to monitor while assessing the volatility in equities.
Nifty 50 Outlook: Key Levels and Time Cycles
In a nutshell, looking at the overall wave pattern and time cycles, 28 September becomes an important date to watch, as the 85-week cycle is forming around that period.
Until then, the possibility of the ongoing downtrend continuing remains important from the time-cycle perspective.
We would want to see a faster retracement on the upside, as per Neowave logic, followed by a strong breakout to confirm an upside reversal.
Key levels to watch:
Upside:
- 23,420 — first important level for an upside reversal
- 23,572 — next important level
A sustained move above these levels would be important for confirming a stronger upside reversal.
Downside:
- 23,180 — immediate crucial support
- A breach below 23,180 could resume the downward trajectory towards 22,970.
Therefore, traders should closely monitor the interaction between price, time cycles and the Elliott Wave structure, rather than focusing on price movement in isolation.
Learn Advanced Technical Analysis with Brahmastra
Brahmastra — Technical Analysis Mentorship
Learn the science of trading with algo creation, stock selection, options trading, Elliott Wave and Neowave.
In the Brahmastra sessions, you will learn how these concepts can be combined to develop a structured approach to market analysis and trading. Know more
Advanced Technical Analysis Training — Elliott Wave, Neowave & Options
Our 3-month Trishul Advanced Technical Analysis Training focuses on Elliott Wave and Neowave concepts along with powerful options strategies.
Learn the complete science of trading using the principles of Elliott Wave, Neowave and options, including techniques for market forecasting and identifying potential market structures.
The next session is scheduled for 10th and 11th October, Saturday and Sunday.
Limited seats only. Fill the form below for more details.