NIFTY 55-Day Time Cycle & the FLD (Hurst) — How to Time Swings and Trade with Confidence
Dec 11, 2025
Time cycle analysis proves that it is possible to time the market. Most traders grow up hearing the opposite — “Never try to time the market.”
But the study of cycles shows that markets move in rhythmic patterns, and when these patterns are measured scientifically, they offer powerful forecasting capabilities.
This research applies J.M. Hurst’s Time Cycle principles — originally developed by an aeronautical engineer who discovered cyclical rhythm even in stock market data — to the Indian markets and NIFTY. We extend Hurst’s methodology using the 55-day time cycle and FLD (Future Line of Demarcation) concept to understand how NIFTY has been responding to these cyclic forces.
Nifty daily chart with Time cycle and FLD
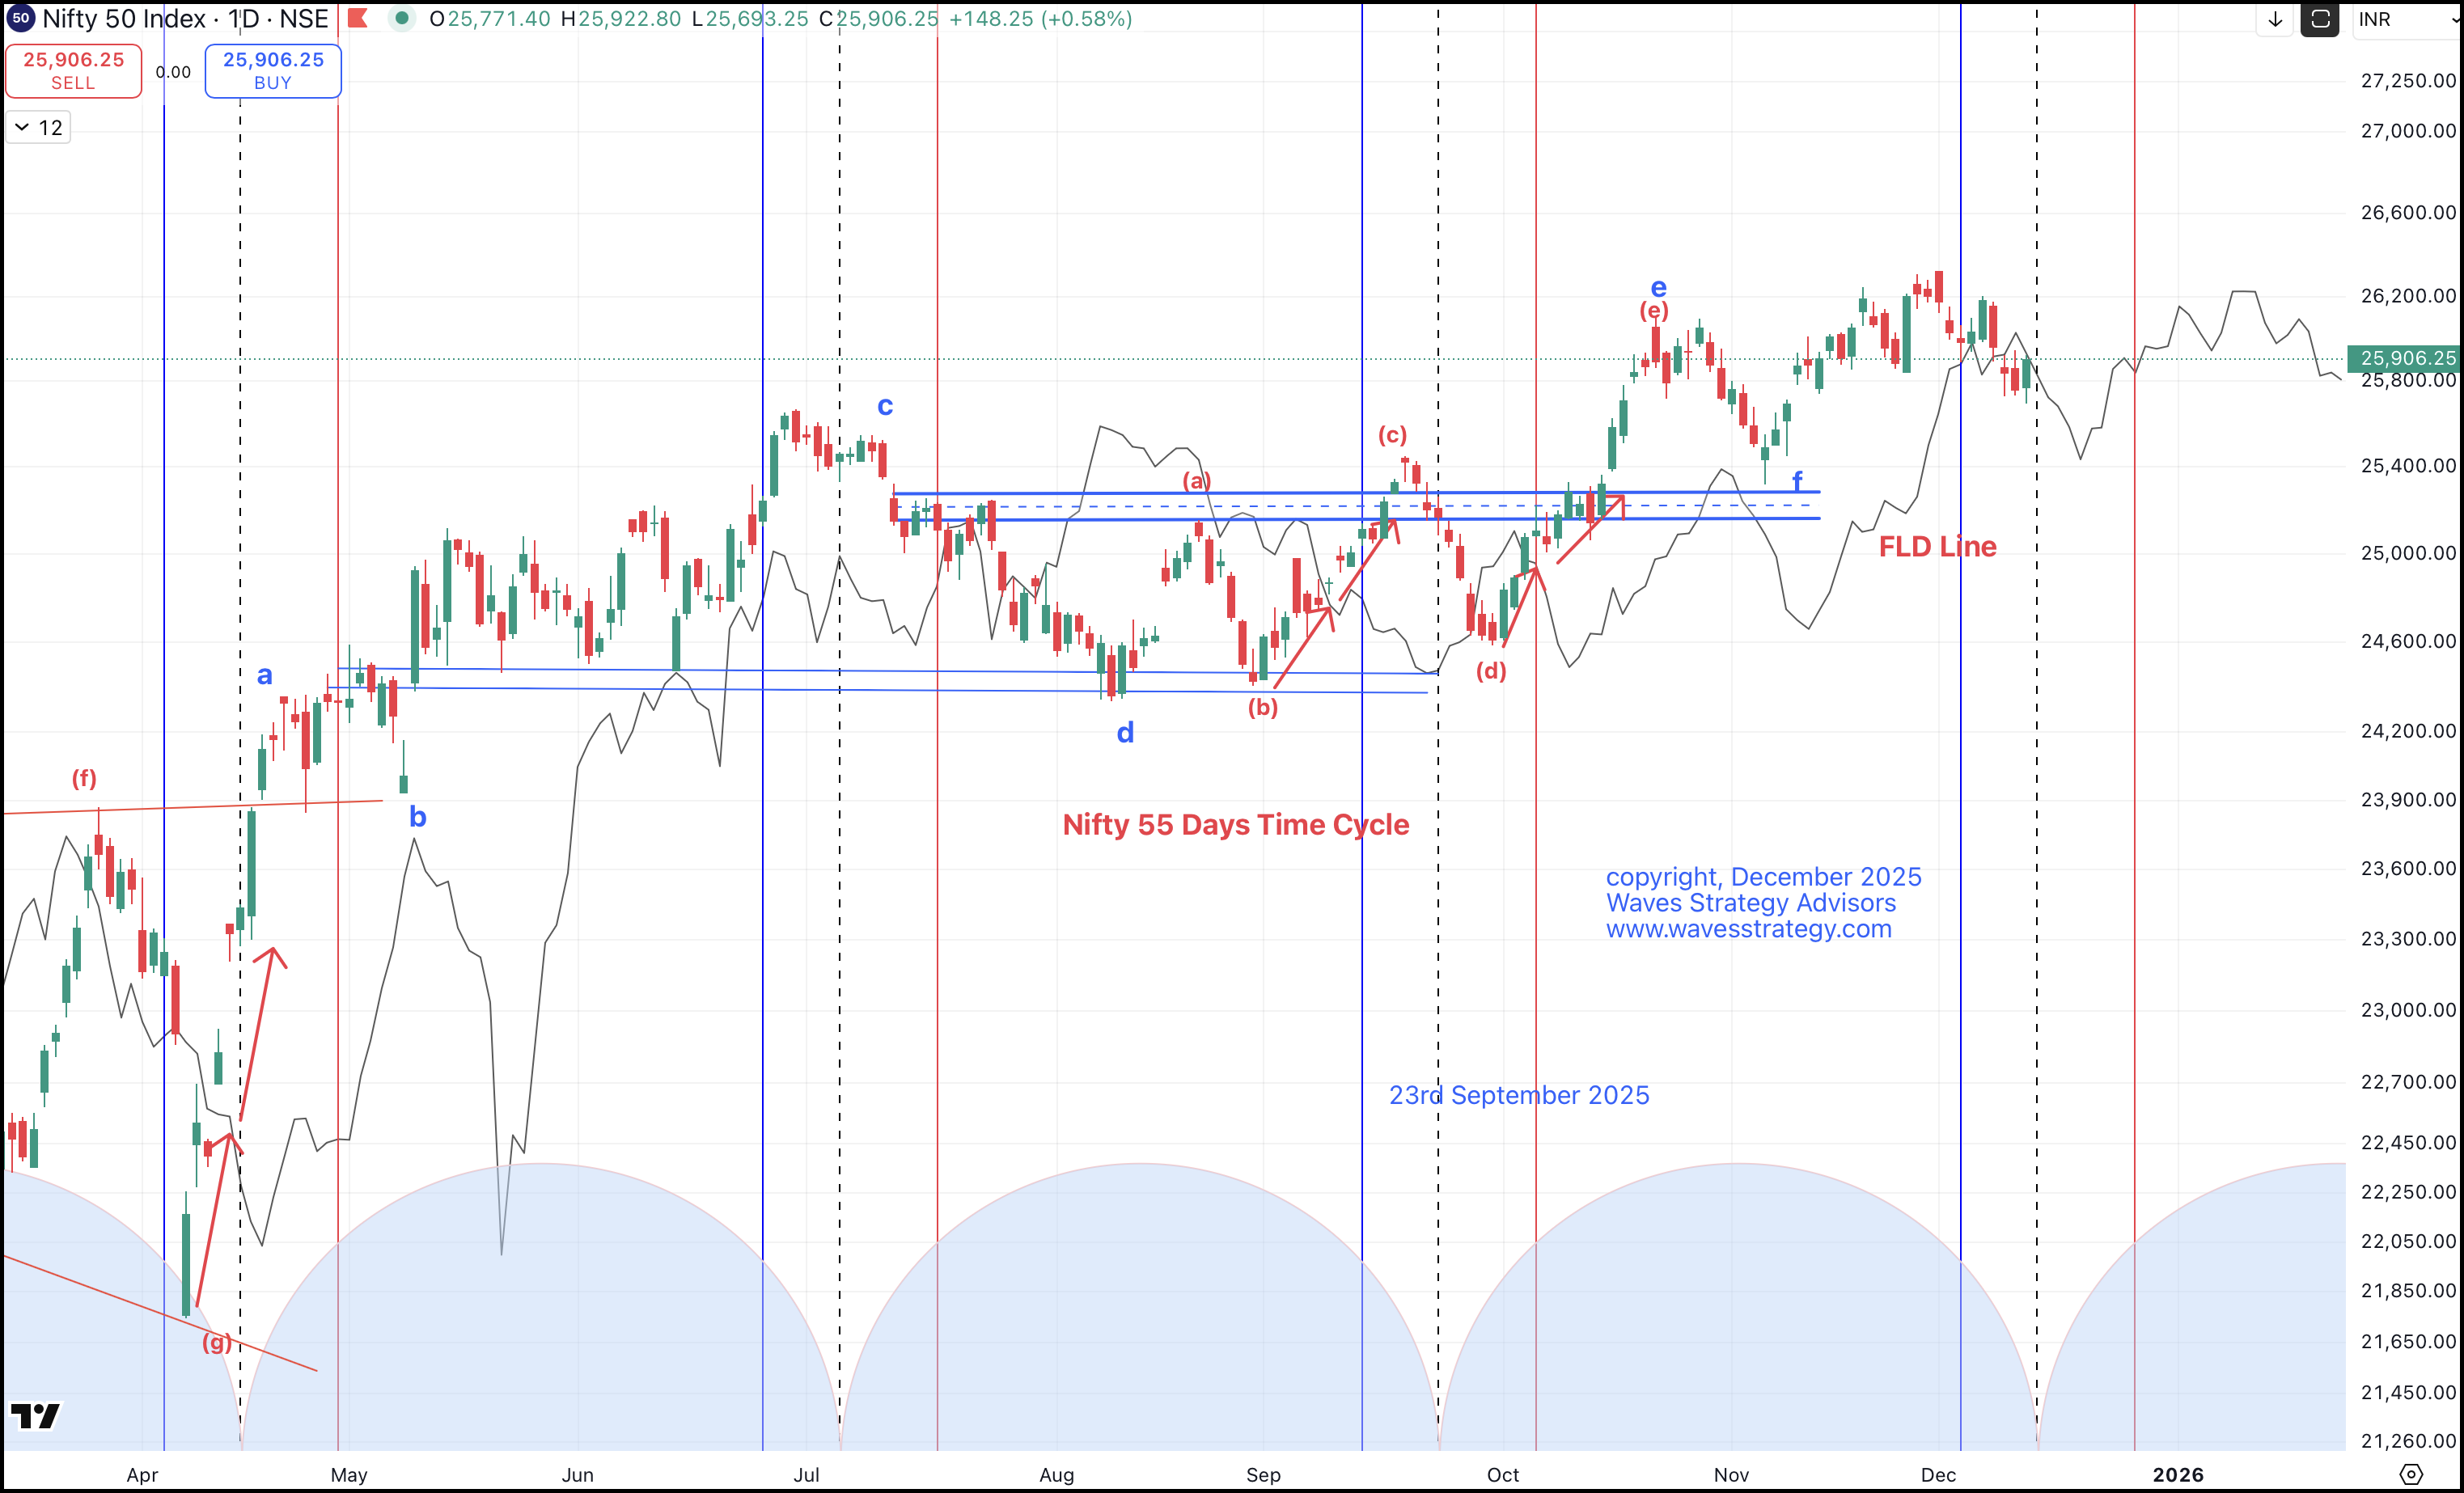
NIFTY Daily Chart: 55-Day Time Cycle and FLD
The accompanying NIFTY daily chart uses Hurst’s methodology to plot the 55-day dominant cycle. As seen on the chart, NIFTY has been following this 55-day rhythm remarkably well.
There are three vertical lines marking the time cycle zone:
- Blue line
- Dotted black midline
- Red line
Together, these form what we call the Cycle Zone.
Understanding the Cycle Midline
The dotted black midline represents the exact theoretical cycle point.
But since time is a dynamic element and cycles are not perfectly rigid, we apply a 10% leeway.
For a 55-day cycle, this translates to ±5 days on either side.
According to this midline, the current cycle date is projected near 12th December.
However, timing alone is not sufficient — we also need price confirmation.
A close above the prior candle high will be the first indication that the trend is turning upward from the cycle low.
But since time is dynamic, the market may require a few additional days (within the leeway zone) before completing the low.
Role of the FLD (Future Line of Demarcation)
On the chart, the black line represents the FLD, an essential tool from Hurst’s model.
The FLD is plotted based on the time cycle and serves as:
- Support
- Resistance
- A projection tool for targets
How FLD Projections Worked Previously
Using the FLD, upside projections were calculated from the April 2025 low.
Notice the pattern:
- FLD intersection occurred at the cycle midline,
- Followed by an upside move that achieved its projected targets.
The same behavior was repeated:
- In August
- In September
Each time, FLD interactions aligned with the 55-day cycle, resulting in highly accurate projections.
Current Market Position: Critical FLD Intersection
In the current cycle, the most recent FLD intersection is on the downside, but price is still within the time zone.
This makes the current juncture extremely important.
Key Levels to Watch
- Bearish Confirmation
If NIFTY closes below 25,728,
→ downside projections open up,
→ suggesting the market may respect the FLD bearish intersection.
This may also indicate a 2–3 day delay in forming the cycle low.
- Bullish Reversal Confirmation
If prices intersect back above 25,950 and close above it,
→ this will generate a positive FLD intersection,
→ within the 55-day cycle zone — a powerful bullish indication.
If this happens, the wave structure suggests that:
- Wave G targets toward 26,600 may open up,
but this will only be considered once we see a close above the prior day’s high.
Why Price–Time Alignment Is Essential
In time cycle research, price alone is insufficient, and time alone cannot trigger a trade.
The true power comes when price and time synchronize.
When both:
- Cycle timing aligns, and
- Price action confirms the turn,
trading becomes simple, high-probability, and risk–reward becomes extremely appealing.
This is the real strength of combining NeoWave analysis with Hurst’s Time Cycles.
Final Summary
To keep the market outlook objective and rule-based:
✅ Bullish Confirmation
- Close above 25,950
- Indicates price and time are back in symmetry
- Opens the door for an upside reversal and potentially Wave G targets near 26,600
❌ Bearish Confirmation
- Close below 25,728
- Warns of weakness
- Can lead to 2–3 days delay before the cycle low is formed
- Activates downside FLD projections
Until one of these levels is taken out, the market remains in the time cycle zone, and traders should watch for decisive signals.
Mentorship: Learn to Time the Market with Brahmastra
If you want to truly master the art of timing the market, you can learn the complete framework in just three months through the Brahmastra Mentorship Program.
This is not a theoretical course — it is a hands-on mentorship designed to transform the way you analyze and trade the markets.
What You Will Learn
- How to time the market using cycles with precision
- How to combine time cycles + NeoWave + stock selection algorithms
- Clear trade setup strategies with predefined rules
- How to derive accurate stop-loss and target levels
Exclusive Benefits
- Access to a private community of serious traders
- Real-time guidance and learning support
- Limited seats to maintain personal attention and quality
The Brahmastra Mentorship can completely change the way you see the market — giving you the confidence to time entries, exits, and major turning points with a structured, rule-based approach.
If you want more details or wish to apply, fill the form below.