Hurst’s 55 Days Time Cycle – Nifty to Bottom near 18th May – Why?
May 02, 2022
Like this Article? Share it with your friends!
Time Cycles and Advanced Elliott Wave – Neo wave both are amazing forecasting tools for Traders.
As per 55 Days Time cycle we should start seeing bottoming formation between 18th May to 27th May 2022. Below is the chart showing Price and Time symmetry.
Nifty Daily chart:
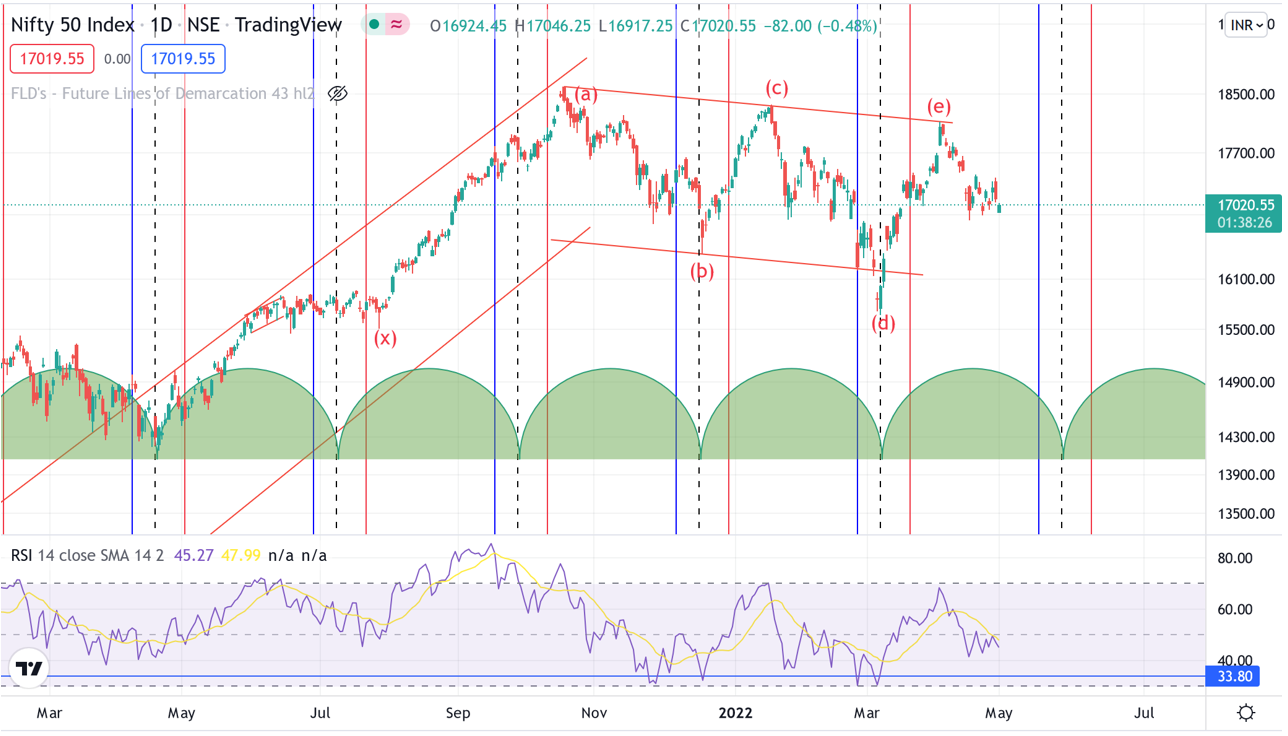
Nifty Neo wave pattern – Nifty has continued to move in a medium term downtrend despite of sharp recoveries we have seen in between. The overall chart pattern is suggesting prices are moving in Diametric pattern and is currently traveling in form of wave (f). This wave (f) can continue until 18th May – 27th May post which we can start seeing move on upside in form of wave (g).
Time Cycle 55 Days – We have been using this time cycle since a decade and it has worked exceptionally well. In the above chart one can see important lows being formed near this cycle and prices reversing back on upside. Also we are now in second half of the cycle which represents sell mode as long as the top near 18000 remains protected.
With above information one can form Option strategies and accordingly sell Calls of faraway strikes to keep riding this downtrend going on and at the same time not getting whipsawed in Gaps.
In a nutshell, Elliott wave – Neo wave along with Time Cycles is lethal combination especially for Option Traders and can be used once one understand the concept in totality.
Master of Waves Season 3 - Learn Trade setups for Intraday to Positional on Stocks, Commodity, Options using Neo wave and Time cycles. This is simple method provided you understand it from someone who has been practicing it for years. Be a part of the Elite Traders community #TimeTraders and time the market like a pro. 2 days of Live event on 28th – 29th May 2022, Early Bird ends on 10th May, Limited seats only, register now over here