Nifty 85-Week Time Cycle, Volume Profile & Key Support Levels: Will 24,100 Hold Amid Global Tensions?
Mar 04, 2026
Nifty is approaching a critical support zone near 24,300 as the 85-week cycle aligns with key volume profile levels. Global tensions and macro events are increasing volatility in the Indian stock market.
It is not only the war situation that is affecting sentiment. The latest announcement that a US court has rejected the Trump administration’s plea to delay the refund by 90 days can turn into a massive event shock for the US Treasury. This development could potentially trigger spiraling financial activity at a time when global tensions are already elevated.
Because of these factors, global markets are witnessing nervous price action, and the Indian markets are reflecting the same through gap movements.
Nifty 85 weeks Time cycle with Channel support chart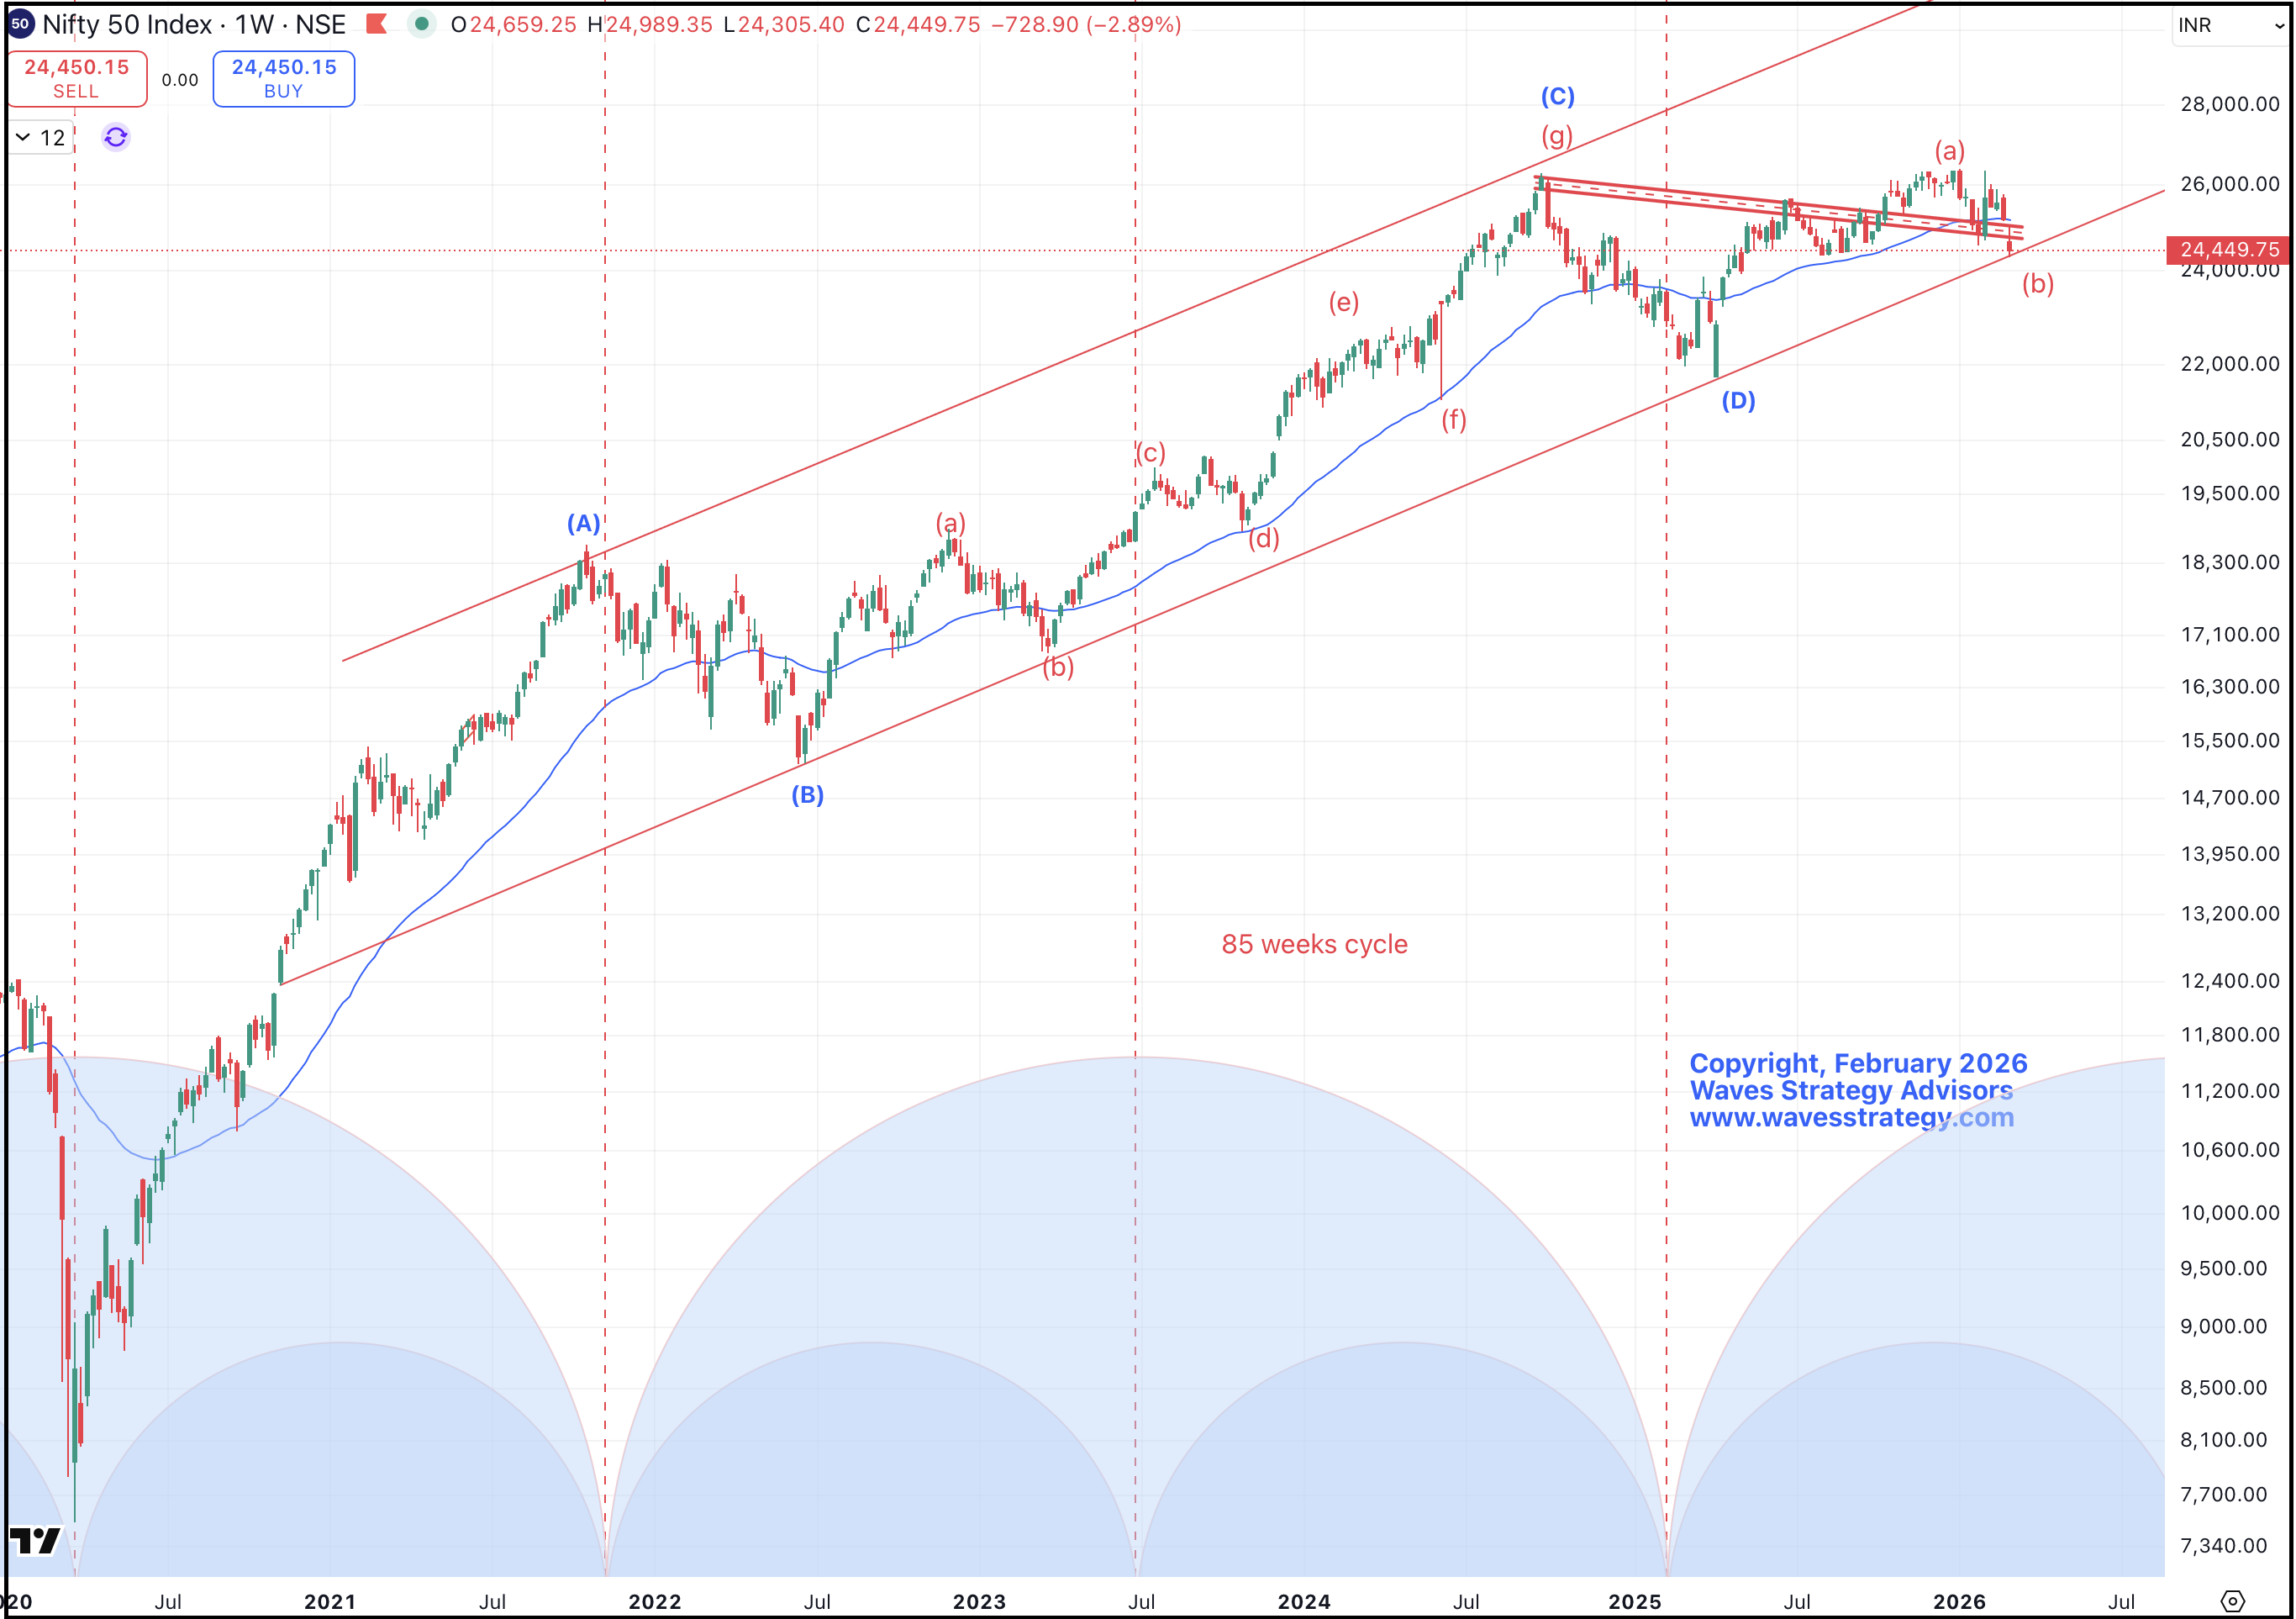
Nifty Volume profile chart: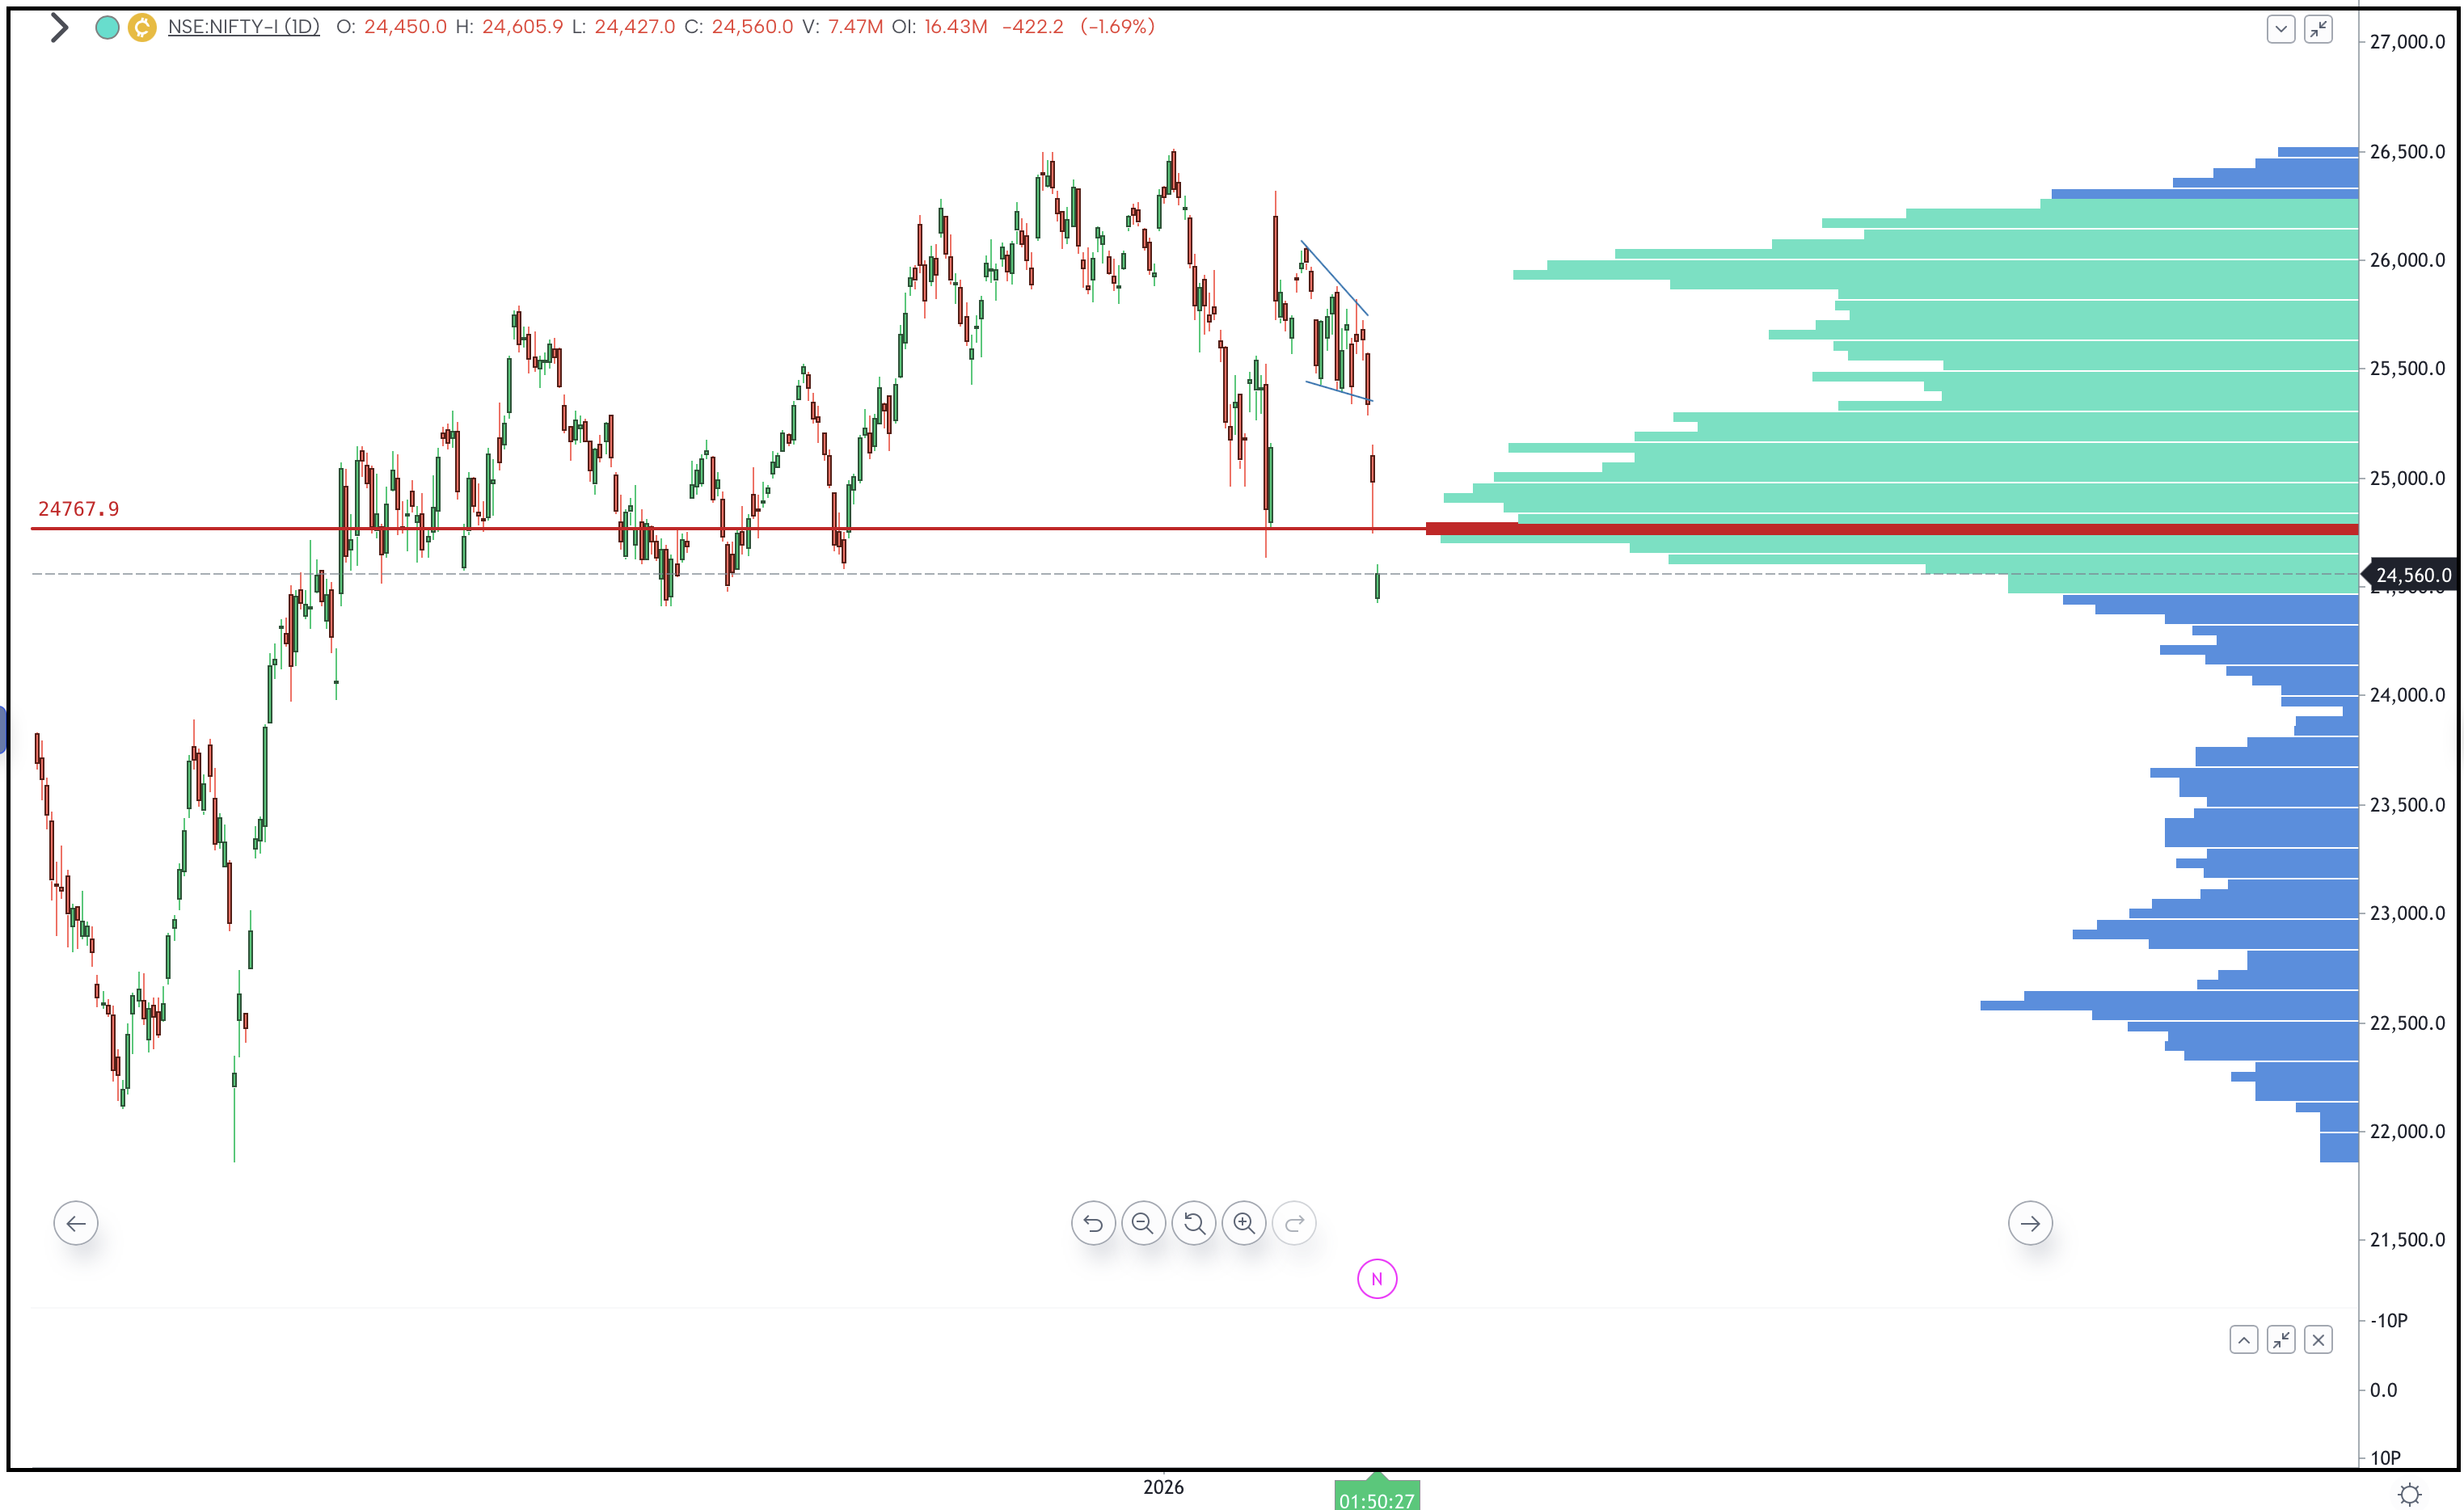
Nifty 85-Week Time Cycle Signals Critical Support
The 85-week cycle on Nifty indicates that the price has arrived near an important trendline support. This level has been anticipated for several years and prices are currently hovering around that zone.
The key level to watch is 24,300 on a weekly closing basis.
- As long as 24,300 remains protected, the overall medium-term outlook can remain positive.
- Any weekly close below 24,300 or 24,100 will be a sign of concern and could lead to further selling pressure in the index.
Therefore, the coming weeks will be crucial in determining whether this structural support holds.
Nifty Volume Profile Analysis
The volume profile analysis shows that the 24,728 spot level is where the maximum volume activity has taken place.
Usually traders observe volumes forming near bottoms, but in this case we are seeing volume at price, which reflects participation by larger players at specific price points.
The zone between 24,700 – 24,728 has witnessed the highest activity, indicating that this is an important reference level for market participants.
At present, prices are trading below this level, and therefore:
- A move back above 24,728 will be crucial for stability.
- Sustaining above this level can support bullish activity.
55-Day Time Cycle Outlook
Another important observation is the 55-day time cycle.
From 4th March, the 55-day time cycle is expected to begin turning back on the upside. However, price confirmation will remain essential before any bullish expectations can be considered valid.
A positive reversal signal would require:
- Close above the prior day’s high
- Protection of the prior day’s low
Until such price behaviour emerges, caution is warranted.
Impact of Oil Prices and Rupee Weakness
The closure of the Strait of Hormuz has pushed US oil prices higher, although this may turn out to be a temporary effect.
However, if sustained, it could create:
- Inflationary pressure in India
- Depreciation in the Indian rupee
The rupee has already weakened significantly and has touched all-time low levels near 92 against the US dollar, which adds another layer of macro pressure for the markets.
Key Nifty Levels to Watch
Important levels for traders and investors to monitor:
Support Levels
- 24,300 (critical weekly support)
- 24,100 (major structural support)
Resistance Levels
- 24,700 – 24,728 (volume profile resistance zone)
A breach below 24,100 can trigger further selling pressure.
A move back above 24,728 will be the first sign of stability.
Additionally, a close above the prior day’s high will indicate the first sign of positive reversal in price action.
Trading Strategy: Stay Cautious
At present, markets are moving with gap openings and heightened volatility, and have not yet shown any strong positive price behaviour.
Given the current environment:
- It is best to focus on intraday trading
- Avoid carrying positional trades overnight
- Wait for clear stability signals in price action
The market is currently trading at a very crucial juncture, both from the 85-week time cycle perspective and from the volume profile structure.
Conclusion
Nifty is approaching a decisive zone around 24,300 – 24,100, which coincides with an important long-term trendline support and a key time cycle.
The coming sessions will determine whether the index can stabilize or if further selling pressure emerges.
A move above 24,728 and close above the prior day’s high will be the first indication of stability.
Until then, traders should remain cautious and focus on disciplined risk management.
We will continue to monitor price action closely and share updates whenever a meaningful opportunity arises.
3 months of Mentorship (Brahmastra) on Timing the Market – Apply Time cycles with Elliott wave, Neo wave, stock selection, risk management strategy, exclusive mentorship sessions & trade like a pro. Limited seats, Fill below form for more details