What Happened at 11.30 AM? Nifty Time Cycle Explains Everything
Feb 16, 2026
Nifty follows Time cycles that can provide possible reversal areas. Price action with Hurst’s Time cycle concept is the best combination for traders.
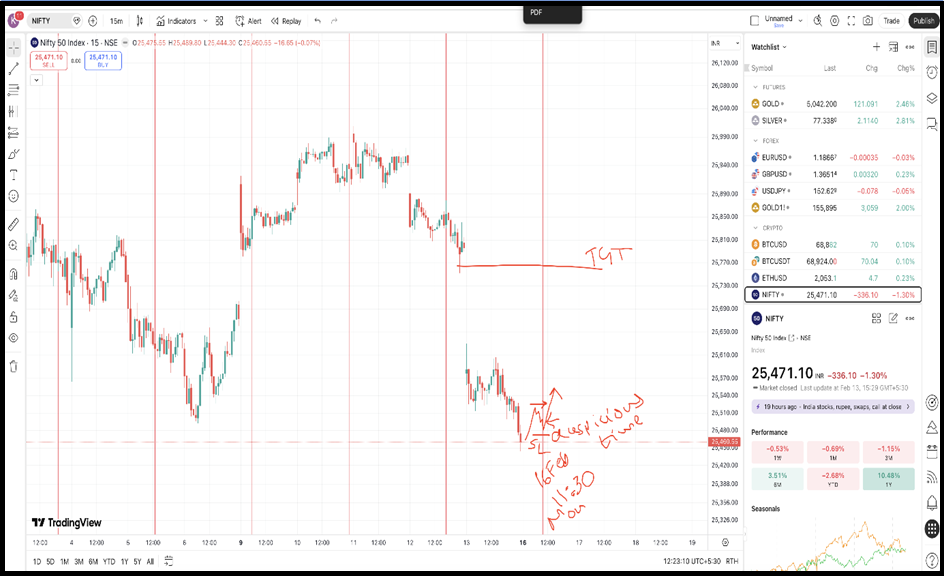
Below is the chart which shows a detailed path of Nifty which we discussed in our recent webinar held on 14th February 2026 with 1000’s of participants.
Nifty 15 min Chart: Anticipated as on 14th February 2026 in a webinar with 1000’s of participants
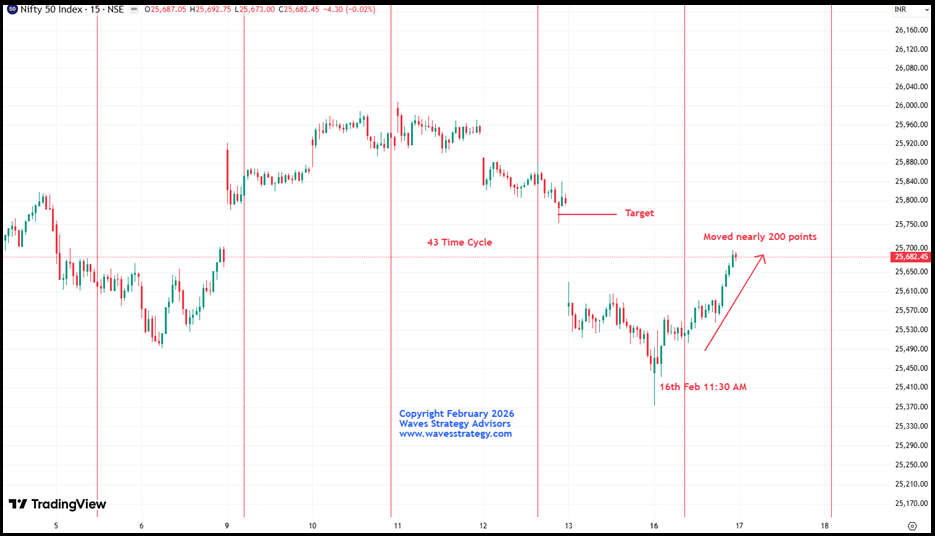
Nifty 15 min Chart: Happened as on 16th February 2026
Time cycles are fractal in nature, meaning they work seamlessly across multiple time frames.
In Nifty, the 43-period Time Cycle on the 15-minute chart has shown remarkable accuracy in identifying short-term turning points.
The 43-period cycle was due on 16th February 2026 at 11:30 AM, and Bang on! the index bottomed near the 25500 level almost precisely at that time. Post this Nifty staged a sharp pullback of over 190 points within a single session, highlighting the power of Time Trading. This reinforces how combining Time Cycles with Price Action can help traders stay ahead of the crowd and anticipate market turns before they occur.
By using science of Time cycle with price action one can stay ahead of the crowd as it can predict lows prior than it has already happened.
In a nutshell:
- Nifty closed above the prior day’s high for the first time after 3 consecutive declining sessions
- Buy on dips remains the preferred strategy
- Upside Gann targets: 25728 followed by 25800
- Key Time support zone on the downside: 25500
3 Months of Brahmastra Mentorship Program on Timing the Market
Time the market to the very day, hour, and minute using a powerful combination of:
- Elliott Wave & NeoWave
- Hearst Time Cycle Analysis
- Stock Selection Algorithm
- Practical Risk & Money Management