Nifty and DJIA (US Equity) What is the Relation?
Jan 07, 2021Global Equity markets along with Nifty and DJIA has continued to move higher and touch lifetime high levels despite of slower momentum.
Look at the below charts of Nifty and DJIA and see if there is any similarity that can be found. We have shown this chart in our daily morning Equity research report – The Financial Waves Short Term update
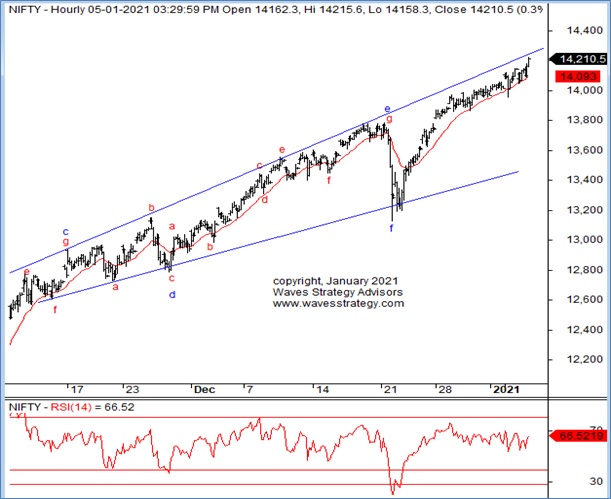
Nifty hourly chart:
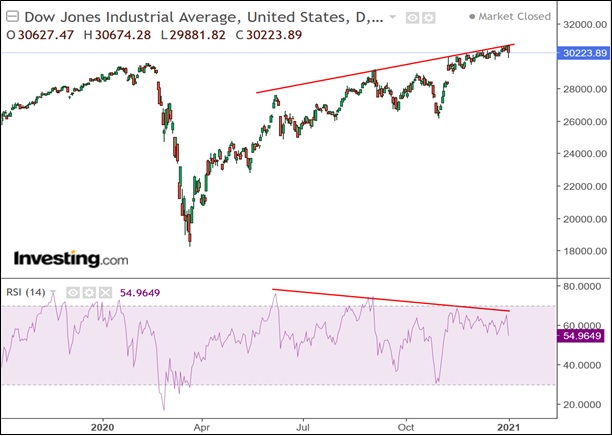
Dow Jones Industrial Average:
Following was mentioned on 6th January 2021 –
The rally that we are witnessing in domestic market is not in isolation as the major global indices are inching higher. During such times it is important to look at the other indices as well and understand the momentum over there. Daily chart of DJIA shows series of negative divergence and the rise in US major index is with slower momentum that can be seen from the RSI making lower highs when DJIA is making higher highs. Also the rise of past few weeks look overlapping in the form of a Wedge shaped pattern. It is important to keep a close track of this index to see if it starts giving any leading indication or breaks above the upper red trendline with fresh momentum. Failure to do that will be a warning sign from the US markets which will eventually translate to global equities as well.
Now coming back to Nifty, we can see that prices are inching towards the upper trendline on both daily and hourly chart. However, as this trendline is upward sloping the resistance will keep shifting higher. However, as mentioned in previous update the risk is increasing with each passing day and it is important to see some correction that will keep the overall trend healthy. Short term support is now near ………. As we are now in 43rd day of up move without closing below prior day’s low it is best to keep riding the uptrend but with a strict stoploss in case there are sudden reversals.
From Elliott wave perspective the overall pattern looks to be Diametric with wave g currently ongoing and the equality target of g to that of wave a comes near ………. levels.
Above chart clearly shows series of lower highs in momentum with increase in euphoria. So where is Nifty and global markets headed from here on? Get access to the daily advisory calls along with Multibagger and Momentum Services over here to capitalize the most from the ongoing up move – Check here
Profitably Trade every wave of the market using Elliott Wave, Neo Wave and Hurst’s Time Cycles on 16th and 17th January 2021. Early Bird Ends on 8th January 2020. Simply pay using Credit Card, Netbanking, PayTM and become the finest trader. ACT NOW Over here