
Nifty at 23800: The Setup Behind the Fall & What’s Next!
Sep 07, 2026
Elliott wave, Gann square of 9 and Time cycle are advance tools which helps to navigate the roadmap ahead of us!
Below is the chart which shows a detailed path of Nifty which we discussed in our recent weekly webinar held on 05th September 2026 with 1000’s of participants.
Let’s understand what has happened in Nifty till now as per the anticipated path and what could come next below.
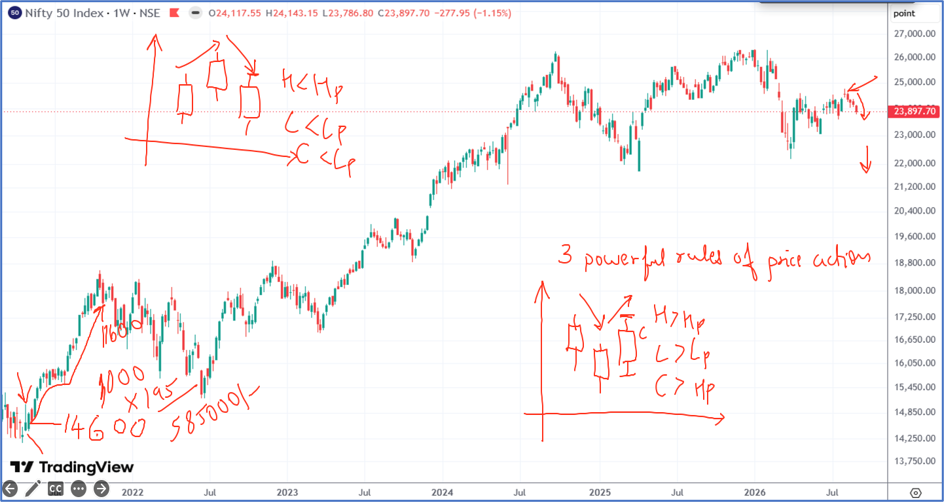
Nifty Weekly chart Anticipated as on 05th September 2026
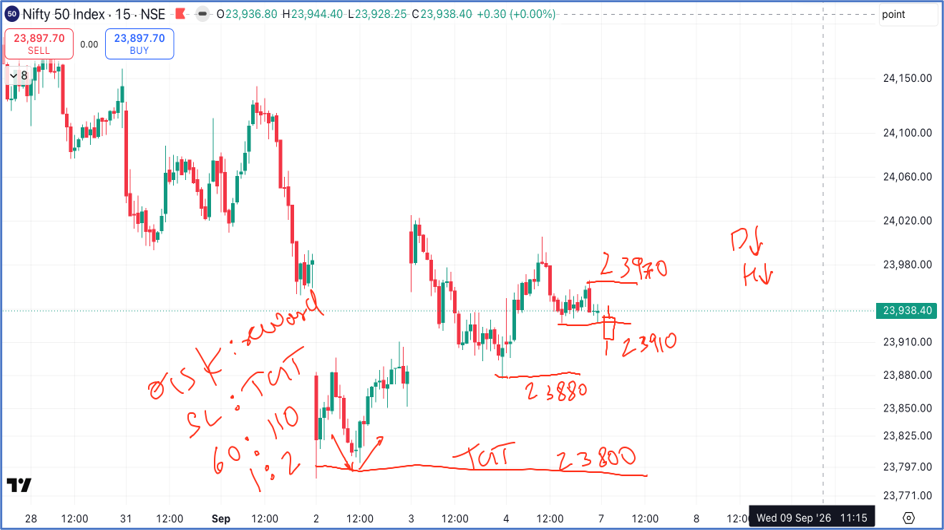
Nifty 15 min Chart: Anticipated as on 05th September 2026
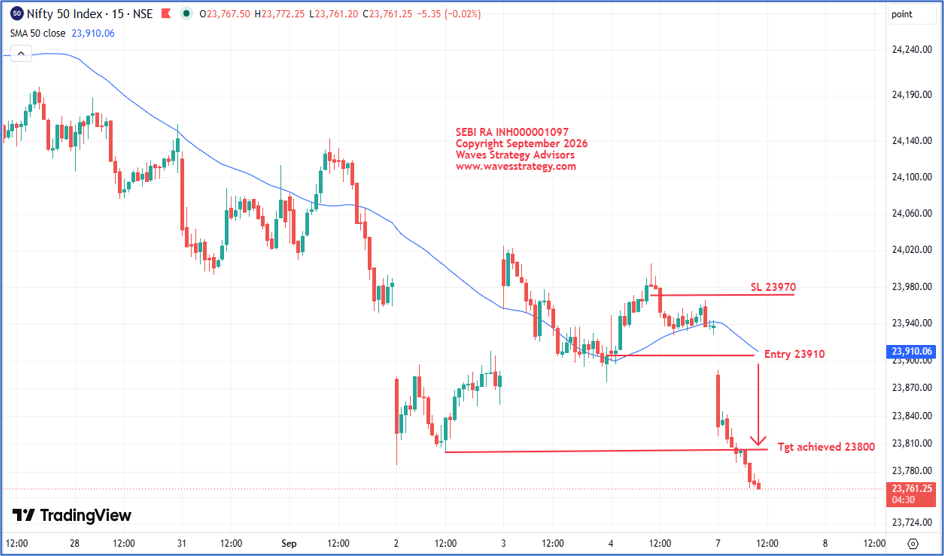
Nifty 15 min Chart: Happened as on 07th September 2026
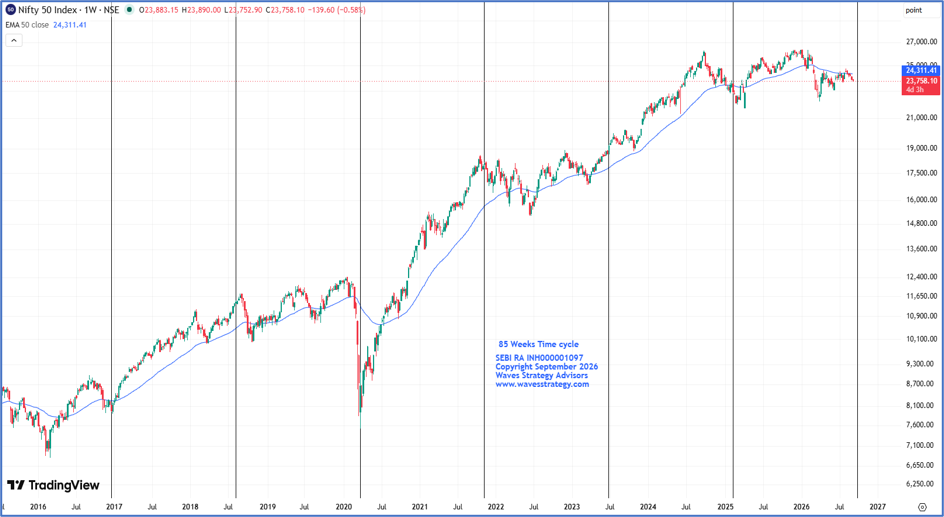
Nifty Weekly chart with 85 Weeks Time cycle as on 07th September 2026
Nifty has played out almost exactly as anticipated. In our webinar, we highlighted that the overall trend had turned on the sell side based on the 3-Candlestick Rule — a low below the prior low, a high below the prior high, and a close below the prior low.
For Monday’s session, we had clearly stated that if Nifty broke below 23910, it could present a selling opportunity for a move towards 23800, as long as 23970 remains protected on the upside. The setup played out as expected. Nifty opened around the 23890 zone and declined sharply to 23800, achieving the projected target and made a low near 23752 levels which is nearly 140 points move.
Sometimes, simple price action combined with Time creates wonder as it helps to identify the move before it happens.
For now, on the weekly chart, Nifty is approaching its larger 85-Weeks Time Cycle, which is due around 28th September 2026. As the Nifty approaches its due date, it could continue to add pressure on the index.
This is also visible in the price action, with Nifty struggling to sustain above near-term resistance level of 24000-24030 and facing selling pressure on every attempt to move higher.
In a nutshell,
- Overall trend looks to be on the downside with Nifty protecting prior day’s high on closing basis since 26th August 2026.
- For now, avoid buying unless we see change in trend as per the 3-candlestick rule on the daily chart.
- One can use pullbacks to sell with next short-term support lying around the 23620 level.
- To stay updated on the Nifty subscribe to our short-term research report Agni Research Report
Brahmastra (Mentorship) on timing the market using Hurst’s Time cycles along with Elliott wave, Neo wave, complete handholding & stock selection algo creation with access to traders community. A mentor can change the learning curve that can take years to a few months. Act now, Know More
Trishul (Options Mantra – Elliott wave – Neo wave) – Trading Options using science of Keltner channel, KST, Supertrend indicator and Price action along with volume profile with Neo wave analysis scheduled on 12th – 13th September & 10th – 11th October. Limited seats only. Fill below form for more details