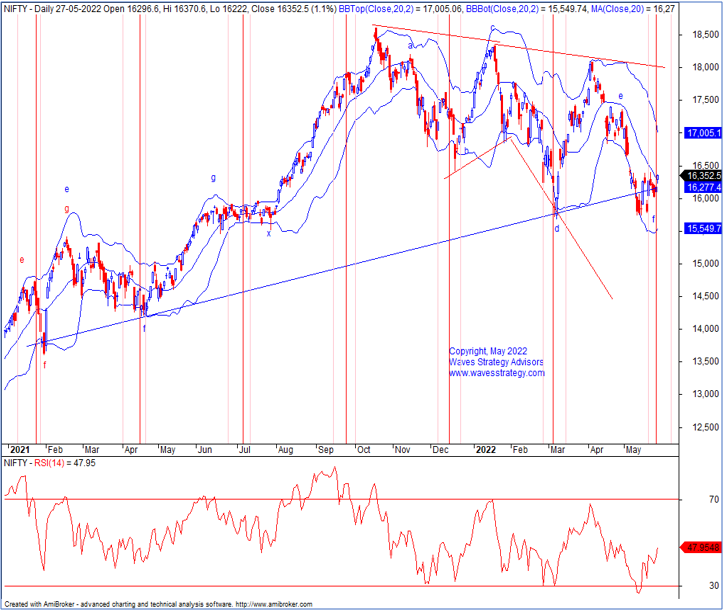
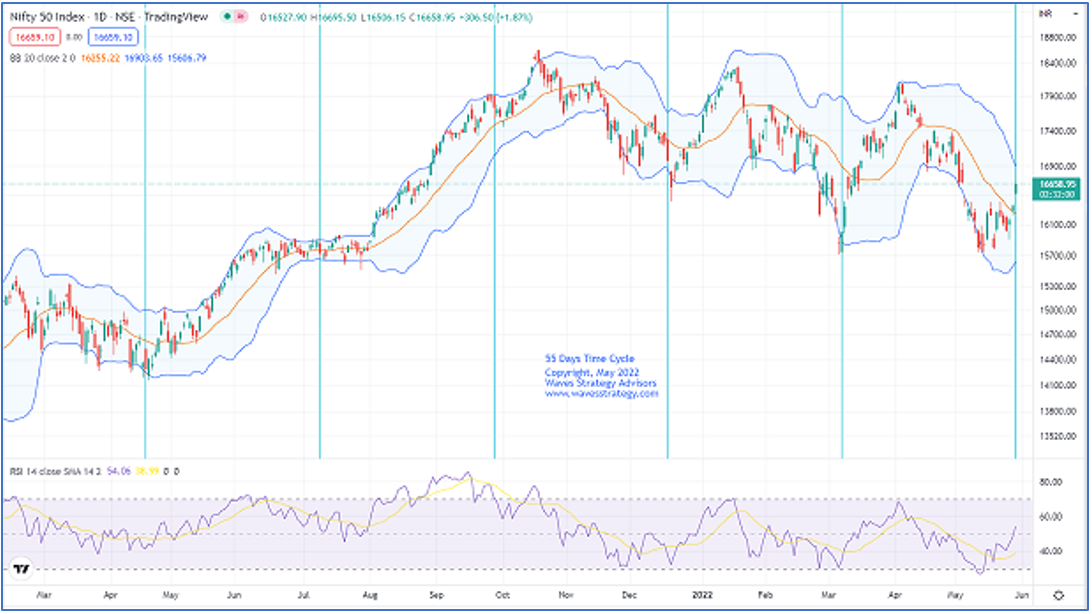
Nifty 55 days Hurst Cycle along with Bollinger Bands
May 30, 2022
Like this Article? Share it with your friends!
Nifty has been moving precisely as per neo wave count. Checkout this example of how we applied Bollinger Bands along with 55 days time cycle to identify the price movement and also to gauge its direction.
We published the following research on 30th May 2022 (pre-market) in the "The Financial Waves Short Term Update" stating why it is time to buy
Nifty Daily chart (as anticipated on 30th May 2022):
Nifty Daily chart (as Happened on 30th May 2022):
Wave analysis as we published on 30th May 2022
On the weekly time frame, a hammer candle is formed trimming all its losses after the volatile week. On the daily chart, Nifty had formed a bullish candle. After the 28-trading session, prices have finally managed to give a close above the mid bands. This suggest that bias have now shifted on the upside. Also, the 55 days cycle might have formed which suggest that bottom might have formed on the downside and we can witness a rally in the coming sessions. Currently, Nifty is moving in form of second correction in which prices are moving in form of wave g.
As shown on the above hourly chart, we can see that prices are moving in a broader range of 16420-15730 levels. Also, the prices are presently whipsawing within the thin ichimoku cloud which suggest range bound movement or in a range. Also, prices have broken its downward sloping channel and continued to move higher. Any hourly close above 16420 levels will provide us additional confirmation that the down move wave in form of wave c of wave f.
In a nutshell, trend for Nifty looks sideways to bullish. A break above 16420 levels can lift price higher towards 16550-16600 levels as long as 16200 holds on the downside.
Happened:
Earlier in the report, we had mentioned that the broader range i.e. between 15730-16420 needs to be broken for the upside reversal. Nifty on the Monday opening had gap up opening and continued to move higher towards 16700 levels. It has further filled the gap area and for now we can expect a dip towards 16500-16540 levels which can be used as buying opportunity.
3 months of Mentorship on Timing the Market July 2022 – Be a part of the Elite #TimeTraders and you will be transformed as a trader. Learn the risk management, money management strategy with algo creation, stock selection, complete trade plan using Elliott wave, Neo wave, Time cycles and handholding with exclusive access to webinars for lifetime. Know more