Nifty Crashed, Options Trade Setups Using Volume Profile!
Mar 25, 2021
Volume profile along with Elliott Wave can give amazing predictability and trade setups.
Nifty has moved sharply lower and broke multiple support levels in just 2 days of time. This is one of the biggest decline in two weeks that we have seen since the lows were formed in March 2021.
Below chart shows Volume at Price or Volume Profile on Nifty Futures hourly chart:
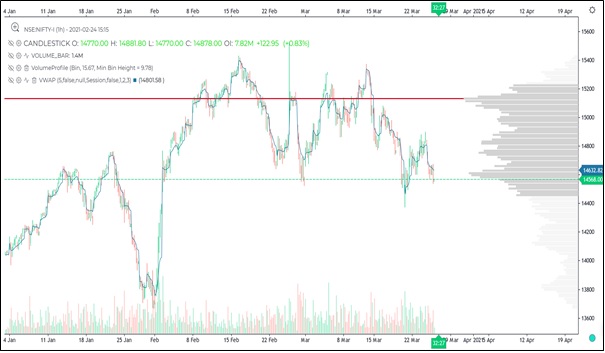
Above chart clearly shows major activity has taken place near 15130 levels followed by 14590. This chart is as of 24th March 2021 and as of now Nifty has already broken below the prior lows as well forming lower highs and lower lows. This is classical Dow Theory confirmation as well that bigger up move is in danger.
So Volume profile shows major distribution or activity has taken place by smart traders and prices have now broken down clearly after the distribution is over.
We combine simple methods with Candlesticks along with Elliott Wave to forecast effectively along with above simple methods of Volume analysis but in a different way
Also Check Nifty 3 Indicators Cannot Be Ignored! Ichimoku Cloud, Elliott Wave and RSI Over Here
In morning daily research report “The Financial Waves Short term update” we have clearly mentioned key levels and why it is time to ride the trend on downside once the supports are taken out. It has worked out extremely well. Stay ahead of the crowd, Subscribe now to latest research report over here
Learn the Science of Trading and see how simple methods like Volume Profile with Candlesticks can be combined to form effective trading strategy in this Season 2 of Become Market Wizard (BMW). Season 2 will be different than earlier and will cover topics which are simple but powerful required for profitable trade setups. No prior knowledge required. Early Bird Ends soon and only Limited Seats available. It is time to become a profitable trader. Contact / Whatsapp +919920422202