
Nifty Below 23,200: The Wave Structure Behind the Fall
Sep 24, 2026
Advanced Neo Wave analysis when combined with price action and AK Indicator can provide a useful framework for identifying potential turning points and trade setups from a short- to medium-term perspective.
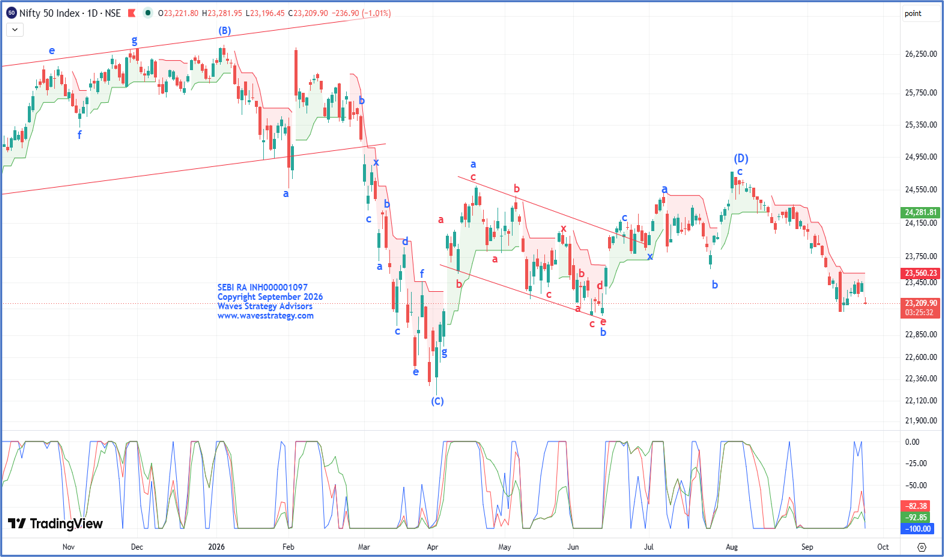
Nifty Daily chart with Neo Wave
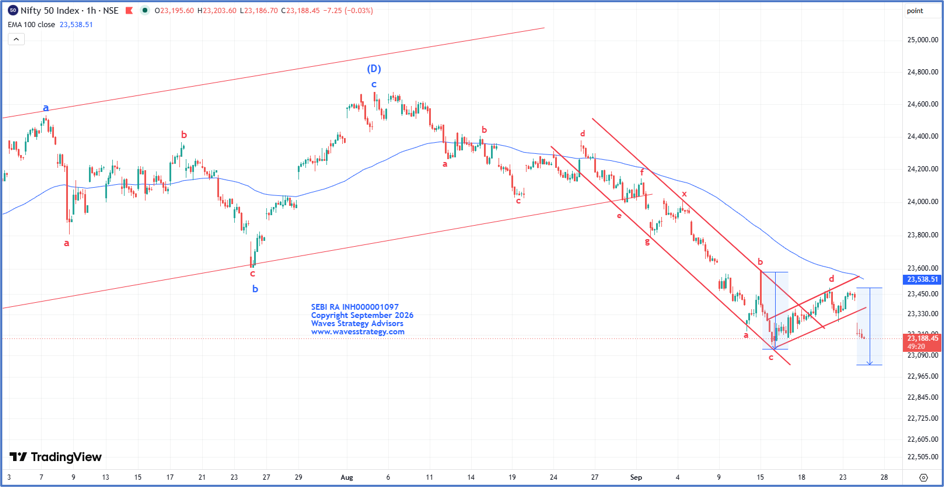
Nifty Hourly chart with Neo Wave
Analysis
- Nifty has been facing resistance near the 23480 zone for the past 3 trading sessions. This level is placed close to the Supertrend indicator, and failure to sustain above this zone has resulted in a sharp reversal on the downside, indicating renewed selling pressure.
- The near-term trend remains under pressure as long as Nifty continues to trade below the Supertrend level of A sustained move above 23560 would be required to signal a change in the current setup, while failure to reclaim this level could keep the index vulnerable to further downside.
AK Indicator
- The AK Indicator is a custom-built indicator which is used to track trend maturity, momentum and trend strength.
- On the above chart, all three lines of the AK Indicator have continued to diverge together on the downside and are now positioned near the -100 level. Such a reading highlights sustained downside momentum and indicates that the prevailing trend remains under pressure.
Neo Waves analysis
- From a wave perspective, the entire rise since April 2026 was unfolding as Primary Wave (D), which appears to have completed in August 2026.
- Since then, the decline has been developing as Primary Wave (E) within a larger Triangle pattern. The internal structure of Wave (E) appears to be forming a double corrective pattern, with the second corrective phase unfolding in the form of a Diametric pattern.
- Within this Diametric structure, wave d (red) appears to have completed near the 23480 zone. The current decline is now unfolding as wave e on the downside.
- As per Neo Wave guidelines, wave e tends to achieve equality with wave c. Based on this relationship, the projected target zone for wave e comes around 23120–23040
Conclusion:
The overall trend for Nifty remains tilted towards the bears, with the current structure indicating continued downside pressure. Traders should look to use pullbacks for a move towards 23120 followed by 23040 levels.
On the upside, 23360 followed by 23480 remains the immediate resistance zone. As long as these levels remain protected, the broader structure is likely to remain under pressure.
Brahmastra (Mentorship on Timing the market) -
Learn to time the market to the very Day, Hour and Minute by combining the concepts of Hurst’s Time cycle on Index and stocks as well, Gann square of 9, Elliott wave, Neo wave and be a part of elite trader’s community who are Time Traders. Fill the form Now
Trishul Membership –
Options Trading with Elliott wave, Neo wave, Ichimoku cloud, and sacred science of trading & forecasting is covered in the Options Mantra Live Sessions – Online Session & Sutra of Waves Live Session – 10th – 11th October. Limited seats only. Fill the below form: