
Nifty Forecast: Elliott Wave, Neo Wave & 55-Day Time Cycle Signal Next Move
Jul 13, 2026
The Nifty has been tracking the market's roadmap with remarkable precision through Advanced Elliott Wave, Neo Wave, and the 55-day Time Cycle. In our morning update on 13 July, we highlighted that if the market opened with a gap-down towards 24,030 and subsequently reversed, it could provide an opportunity for a move towards 24,120. The market unfolded almost exactly as anticipated. The pattern that enabled us to forecast this move is illustrated in the research presented below.
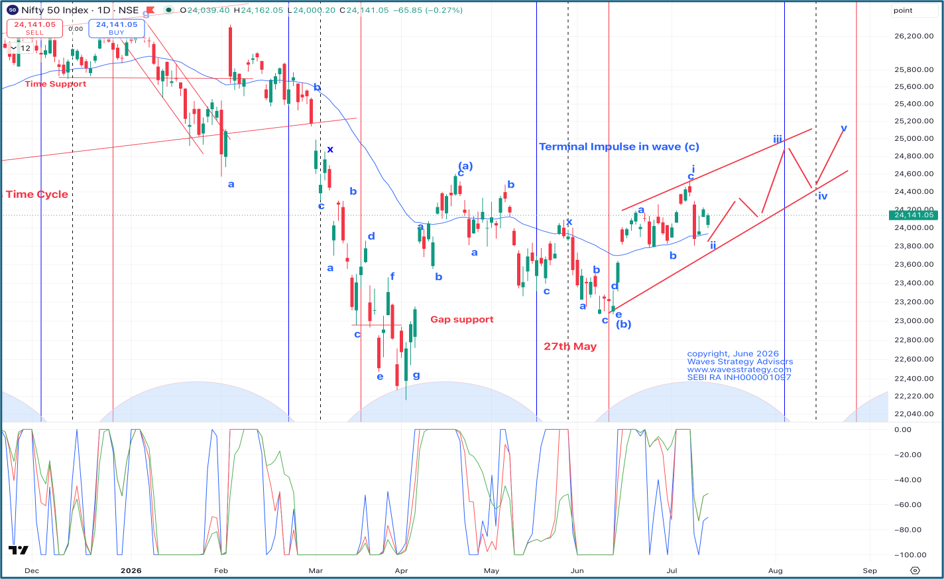
Nifty Daily chart with Neo wave , Time cycle and AK Indicator
Nifty Hourly chart
The Nifty has been witnessing heightened volatility amid renewed geopolitical tensions. However, despite the uncertain news flow, the technical levels have continued to perform exceptionally well. The sharp decline witnessed on 8 July found support almost precisely near 23,800, a level that has consistently acted as a strong support zone since 15 June.
The entire rally from the 10 June low, which marked the completion of the previous 55-day time cycle, appears to be unfolding as a Terminal Impulse Pattern. A Terminal Impulse is a variation of a conventional impulse wave and is also known as an Ending Diagonal Pattern. Unlike a normal impulse, each of its motive waves—Wave 1, Wave 3, and Wave 5—is itself corrective in nature.
As visible on the daily chart, Wave i developed as a Zigzag (ABC) pattern, culminating at the high of 24,530 on 7 July. The subsequent sharp decline, which coincided with geopolitical developments, initiated Wave ii on the downside. At present, the price action continues to suggest that Wave ii is still in progress, as illustrated on the daily chart.
Upon completion of Wave ii, we expect Wave iii to commence, with an initial upside objective near 24,280, followed by a move towards 24,800. Thereafter, Wave iv may unfold until around 14 August, which also coincides with the midpoint of the ongoing 55-day time cycle. The expected path of this movement has been illustrated in the daily chart.
The indicator shown below is our customised AK Indicator, developed to identify whether the market is in a trending or non-trending environment. The indicator consists of three lines—Green, Red, and Blue—each representing different trend characteristics of the market.
When these three lines remain separated, it indicates a non-trending or range-bound market, whereas their convergence signals the beginning of a stronger trending phase. At present, the blue and green lines remain separated, indicating that the market continues to remain in a non-trending environment, which aligns with the broader market structure discussed above.
The AK Indicator also provides valuable support in Elliott Wave analysis. We can clearly observe that Wave i concluded when all three lines converged near the highs before turning lower, initiating Wave ii. Once the Green, Red, and Blue lines converge again on the upside, it would provide additional confirmation that Wave iii has commenced.
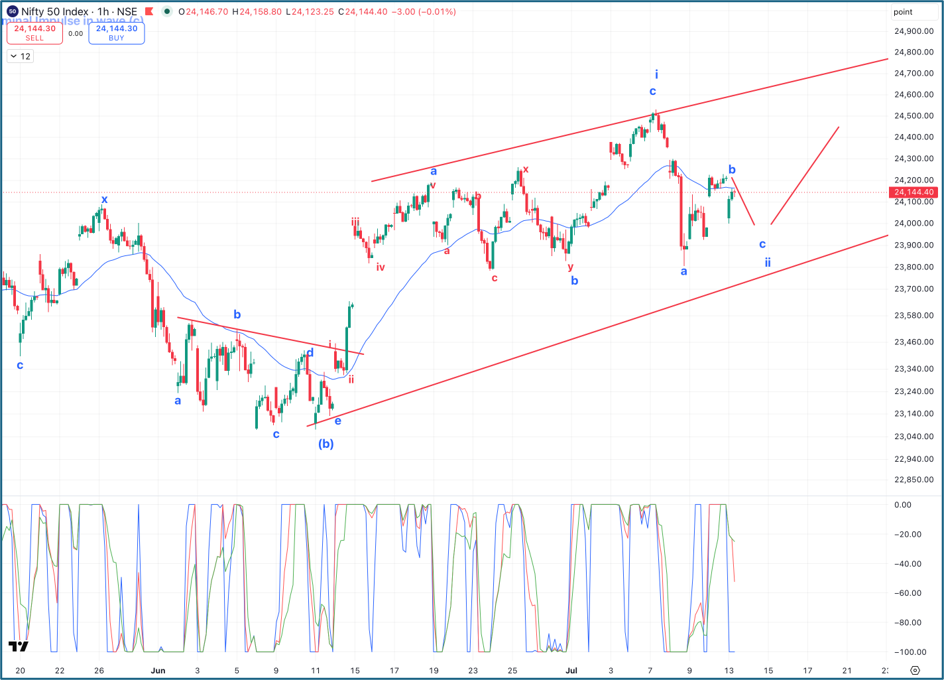
Let us now examine the hourly chart.
The hourly structure suggests that Wave ii remains incomplete unless the market decisively breaks above 24,250. There is a possibility that this Wave ii develops into a Triangle Pattern, which is permissible within a Terminal Impulse structure. In a conventional impulse wave, triangles do not occur in Wave ii; however, within a Terminal Impulse, such formations are entirely valid.
The current market environment reflects considerable uncertainty among traders. While the news flow remains pessimistic, the market has displayed notable resilience. However, this resilience could remain short-lived, and therefore a range-bound movement appears to be the more probable near-term outcome.
Under such market conditions, option-selling strategies, particularly through carefully selected deep out-of-the-money options combined with appropriate hedging, may offer a prudent approach. Positional traders should also consider hedging their portfolios to reduce overnight event risk.
Wave ii may require another one or two trading sessions to complete. Once completed, the market is expected to resume its upward trajectory through Wave iii. Since the anticipated movement is likely to occur with significant price gaps, traders should size their positions according to their individual risk appetite and risk management framework.
Conclusion
In summary, the broader structure suggests that 23,800 continues to remain a major support level, while 24,250 remains an important resistance level in the near term. We expect the market to remain volatile within this range before eventually resuming the next leg of the upward trend.
Advanced Elliott Wave, Neo Wave, and Time Cycle Analysis together provide a systematic framework for understanding market structure, forecasting probable price movements, and developing disciplined trading strategies instead of reacting emotionally to short-term news flow.
Brahmastra Mentorship – Learn the Science of Timing the Market
Master the practical application of Elliott Wave, Neo Wave, Time Cycles, market timing, stock selection, risk management, and professional trading strategies through our comprehensive three-month Brahmastra Mentorship Program.
The next batch begins in July 2026, and seats are limited.
Fill in the form below to receive complete program details.