Nifty Elliott Wave Pattern with Ichimoku Cloud
Nov 24, 2025
Advanced Elliott wave – Neo wave is GPS of the market. It helps to understand the probable path along with Trade setup.
Nifty is showing short term correction post the Lunar cycle on 20th November 2025.
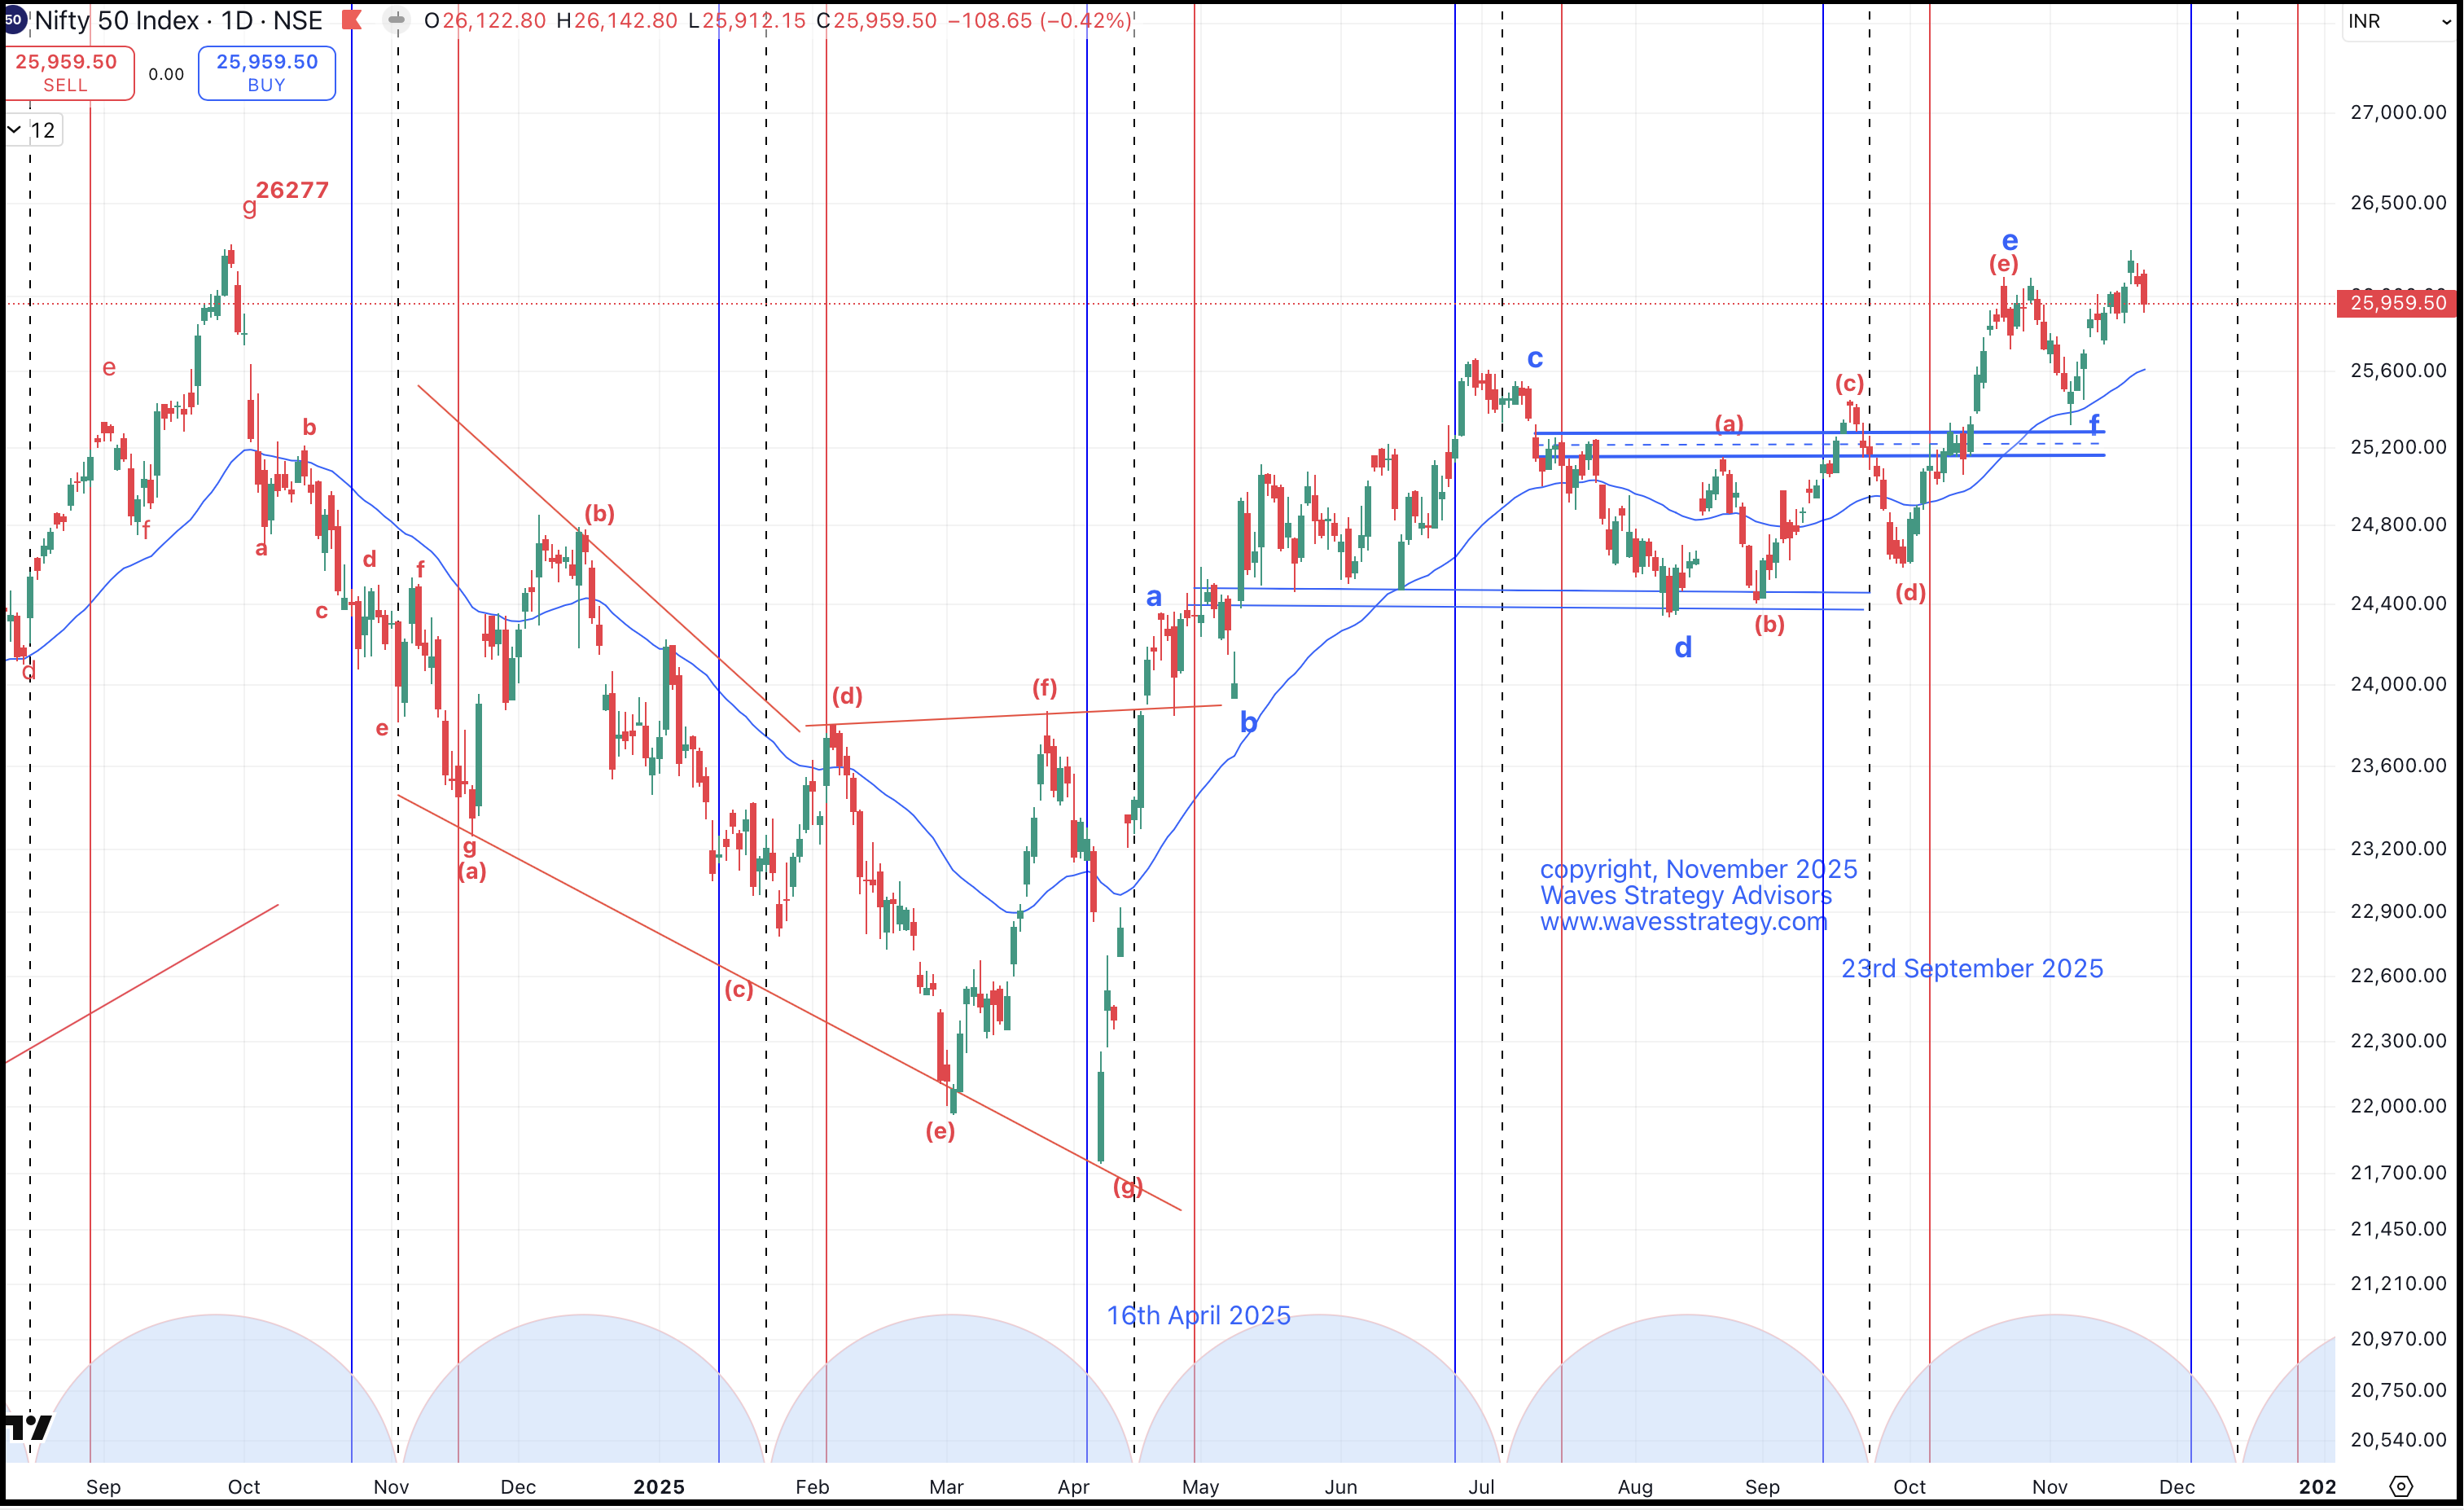
Nifty daily chart:
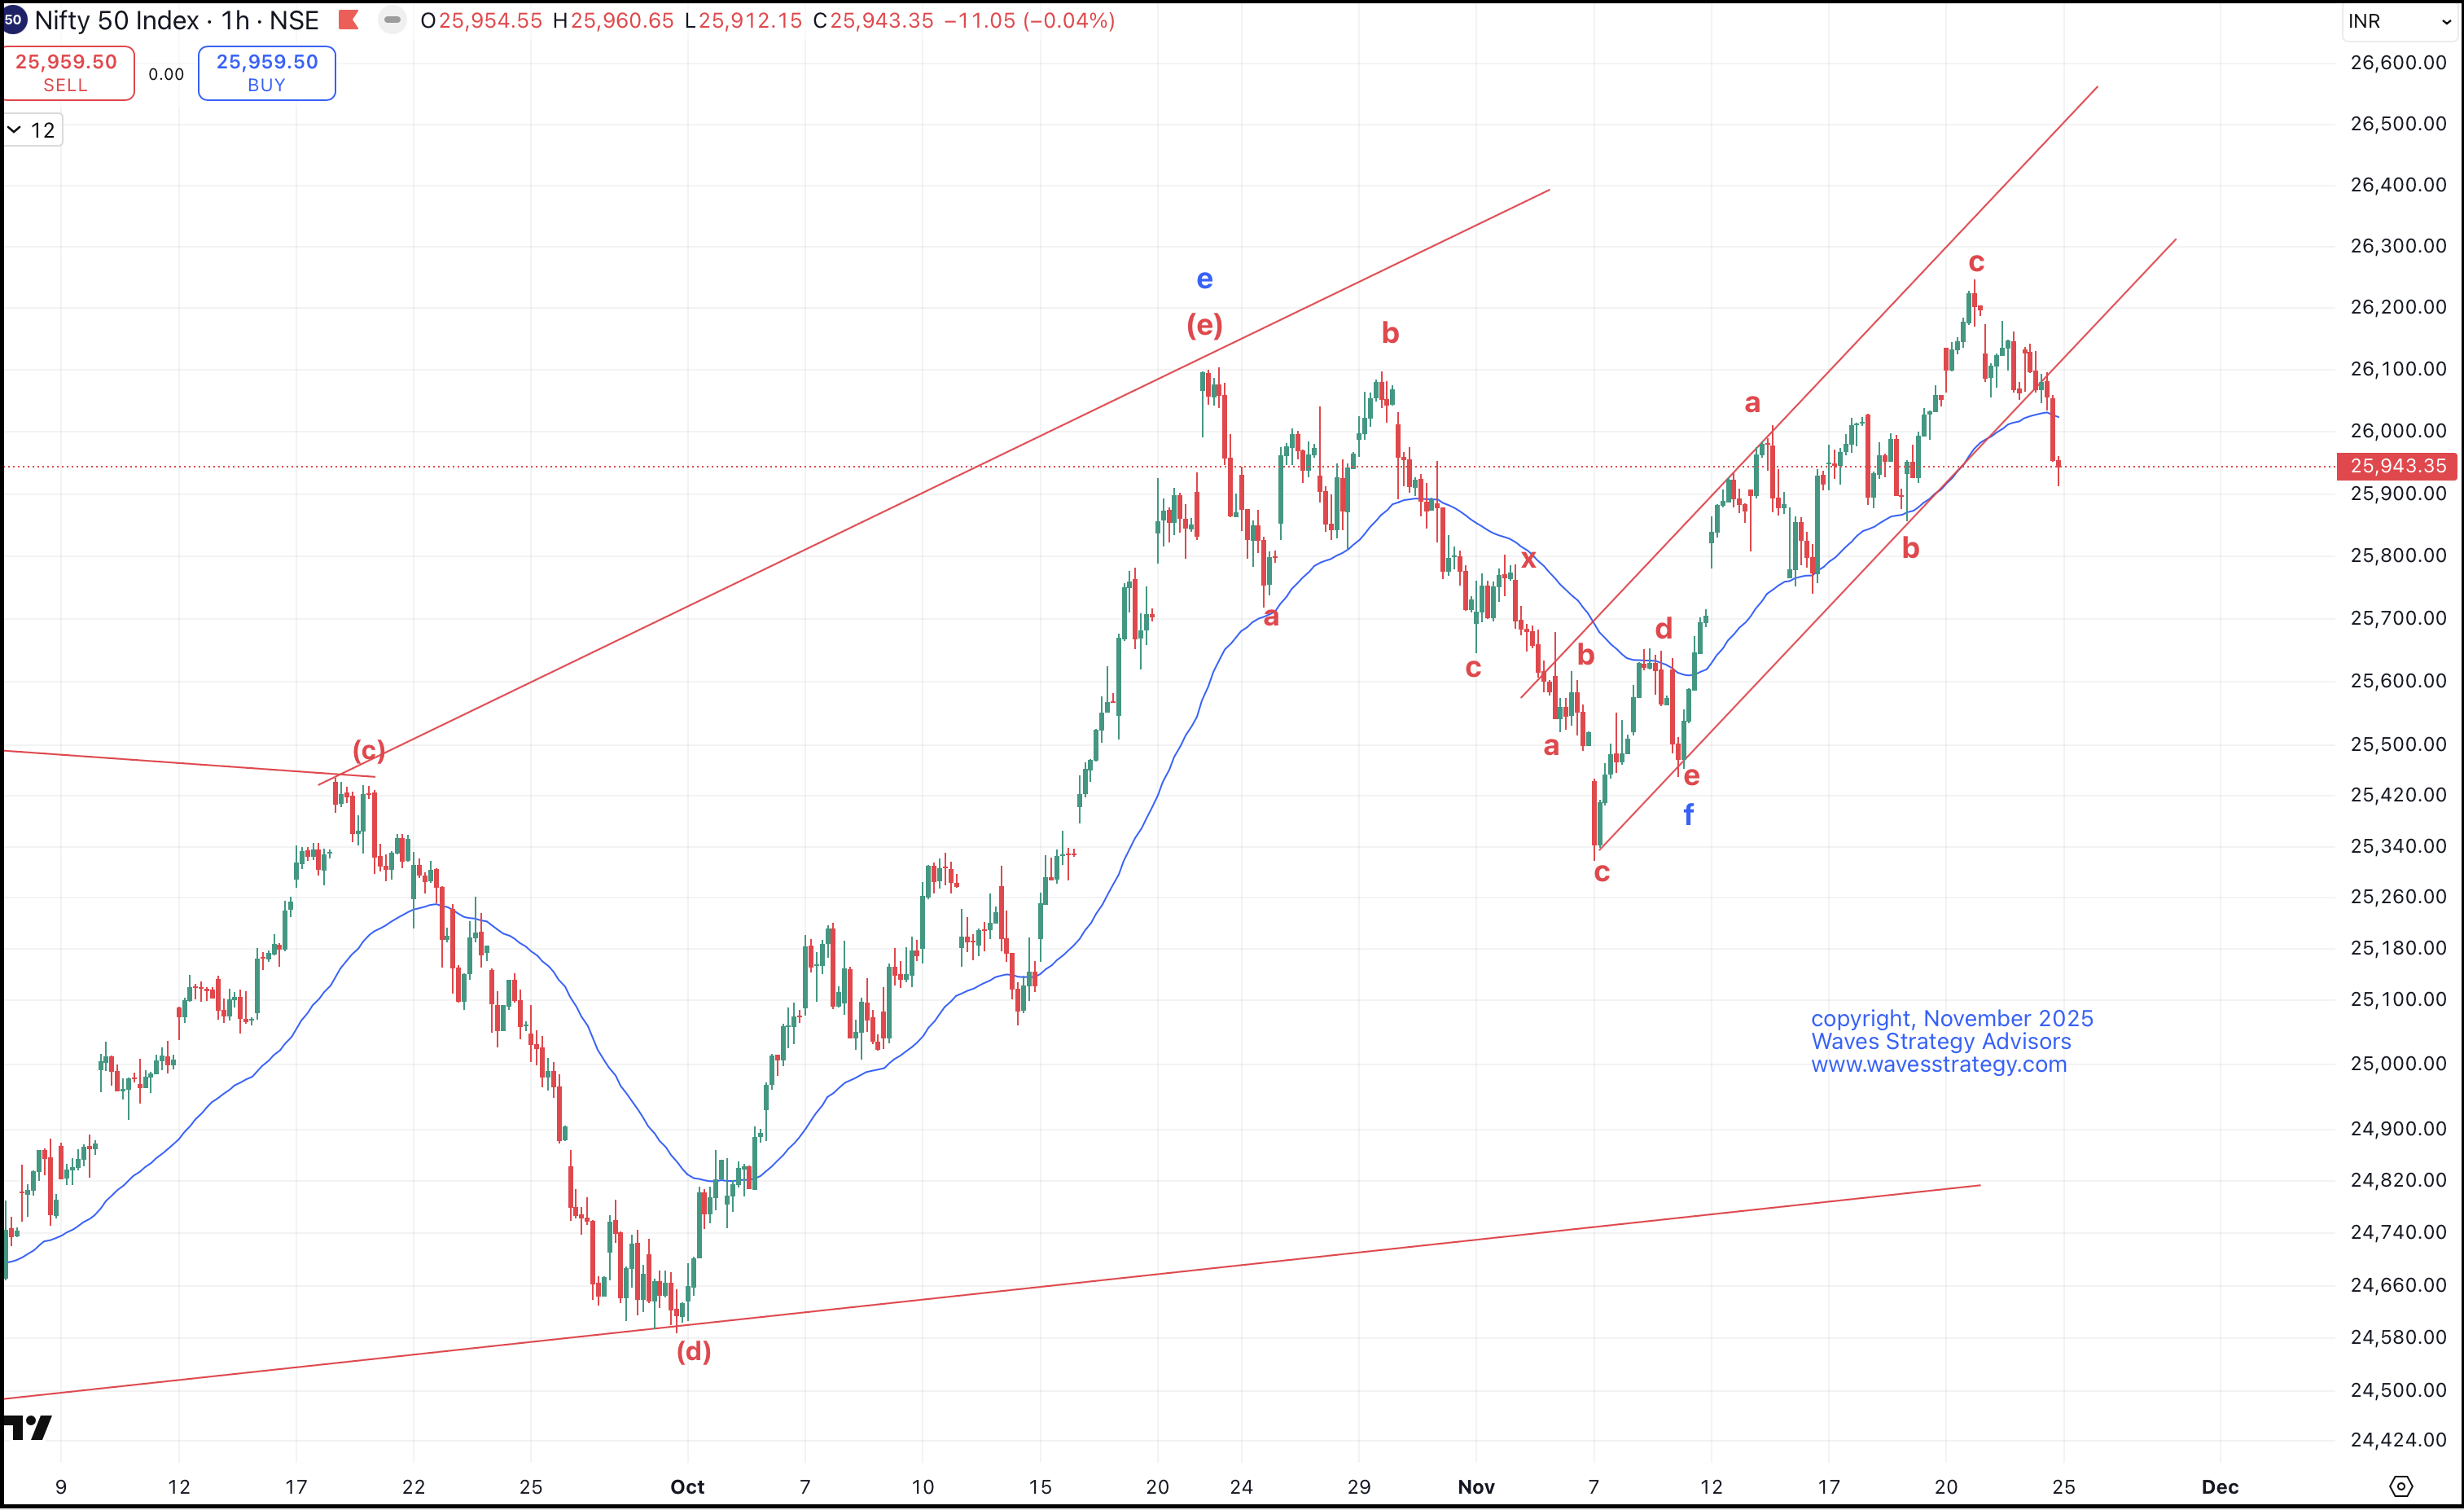
Nifty 15 mins chart:
Nifty Daily Chart Outlook
As per the daily chart, Nifty is currently moving in the form of Wave G. Recently, prices have closed below the prior day’s low, which has resulted in visible pressure on the index over the near term. The level of 26,140 continues to act as a immediate hurdle, with price action oscillating in a tight band between 25,900 and 26,200.
A critical development to note is the Hurst Time Cycle, which is scheduled to come due on 12th December. Because of this, the index is likely to remain range-bound over the short term until the cycle matures.
On the upside, the market needs a decisive breakout above 26,140 to resume its upward journey. However, since we are moving into the later phase of the ongoing time cycle, the probability of short-term consolidation increases before the next leg of the up move unfolds.
Nifty 15-Minute Chart – Indicator-Based Assessment
On the 15-minute time frame, two powerful indicators have been applied:
- Ichimoku Cloud
- AK Indicator
Price Action and Time Support Break
The 15-minute chart shows that prices consolidated for a while before eventually breaking below the time support area, which was positioned around 26,040. This breakdown triggered a sharp decline on the downside, confirming short-term weakness.
Currently, prices are trading below the Ichimoku Cloud, which indicates that there is likely to be ongoing short-term pressure, with the upside hurdle located around 26,140 as per the cloud resistance.
AK Indicator Insights
The AK Indicator turned downwards near the 26,200 zone. Importantly:
- Not a single buy signal has appeared so far.
- A buy signal in this indicator is triggered only when all three lines converge together at the zero level.
- This convergence has not yet occurred, which confirms that the short-term trend remains under pressure.
Wave Structure & Elliott/Neo Wave Perspective
Despite the downside move, this fall is likely to be temporary, evolving in the form of wave x. The entire rise after wave F is possibly developing as a double corrective pattern:
- The first pattern unfolded as a Zigzag correction.
- The market is now in wave x, and once this wave completes, the upward journey should resume.
Summary & Key Levels to Watch
- There is short-term pressure on Nifty.
- A decisive breakout above 26,140 is required to revive the upward trend.
- Any breach below 25,920 may intensify selling pressure, pulling the index toward 25,840.
- Near-term consolidation is expected between 25,840 and 26,140.
- Once this consolidation phase ends, the upward trajectory should resume again.
Mentorship on Timing the Market:
Learn the science of trading by combining Neo Wave, Hurst Time Cycles, and options trading techniques. The mentorship program covers:
- Stock-selection algorithms
- Risk and money management
- Integration of Options with Neo Wave + Time Cycles
- Foundation concepts explained from basics to advanced
For more information on mentorship, fill the form here.
Trishul Membership – December Sessions
Learn to trade options using Elliott Wave, Neo Wave, and the Ichimoku Cloud.
The program is scheduled for 6th and 7th December.
- Early-bird offer ending soon
- Only a few seats remaining
Fill the form below for more details.