Nifty Elliott Wave with PCR Ratio
Jun 24, 2021
Nifty had been stuck in a range over past many days and Option buyers have been losing on either side. We have been maintaining our stand that it is an Option sellers’ market and the below research further highlights key levels on basis of Elliott Wave pattern and PCR ratio published to clients.
Following chart was published in morning on 24th June 2021 in “The Financial Waves Short Term Update”
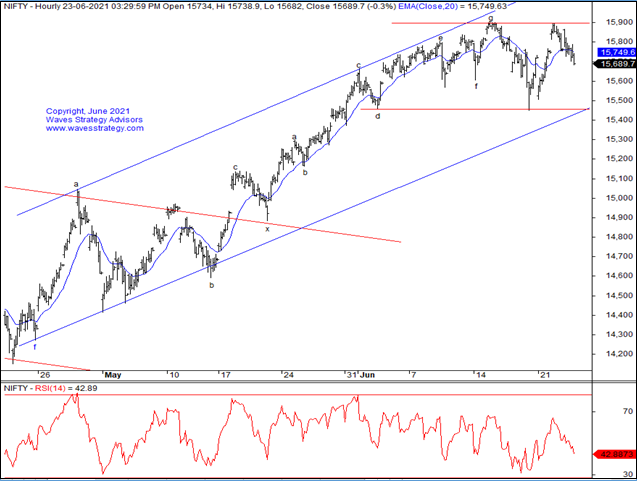
Nifty 60 mins chart:
Elliott Wave analysis: Following was mentioned in the morning research report before markets opened:
In last few updates we mentioned about where writers are active in the current expiry which is due today. During the recent rise near 15895 level, we clearly mentioned that 15900 and 16000 can act as an immediate resistance where Call writers were active.
Let us try to understand where the maximum OI stands along with PCR ratio. Last sessions data indicates that Call writers became further active at 15800 level where PCR slid from 0.56 to 0.26 levels. At 15700 strike PCR slid from 1.26 to 0.76 levels. At 15600 strike PCR increased from 2.75 to 3.39 levels. This data overall indicates that prices can find immediate resistance at 15800 and support is placed at 15600 levels.
The 60 mins chart shows that from last 2 sessions prices are moving lower in corrective manner. There was sharp fall followed by sharp rise towards 15895 level and now again it is moving lower. Such movement often indicates formation of Triangle pattern is possible and hence positional traders should wait for breakout now. As per wave perspective, this can be wave x after double correction pattern however we need to see further price action to confirm the same. Any move below …… will suggest that retracement of the prior rise from 14270 to 15900 level has started.
In short, Nifty is intact in big consolidation range of 15900-15450 levels. Today being the expiry volatility can increase by 3 pm and hence one should trade accordingly. To take directional call, break above …… or break below …….. is required now!
Happened: Nifty continued to move in a range and 15800 indeed looked to have acted as a resistance level and the expiry happened at 15790 levels. This clearly shows that by combining simple OI data along with Wave pattern can help Option Buyers or Sellers to accordingly take the positions.
Get access to the daily equity research report and form trading strategy using scientific approach of technical analysis. Subscribe annually and get monthly research free along with it. Act NOW! Get access here
Mentorship on Technical Analysis to Become a Finest Trader – It takes steps to change the habits or compulsive behaviour to start trading successfully. Disciplined approach and a systematic plan, a clear Goal is must. In this Mentorship program all the necessary tools are given right from stock selection methods, strategy, follow-up action to derive a complete trade setup in step by step fashion. Early Bird Ends on 30th June. To know more check here