3 Powerful Indicators on Nifty, You Cannot Miss!
Nov 10, 2021
Like this Article? Share it with your friends!
By combining Ichimoku Cloud, Elliott Wave, and Bollinger Bands it is possible to form a powerful trade setup.
Nifty Elliott Wave pattern is working in lock step fashion as expected and combining it with Bollinger Bands and Ichimoku Cloud is giving awesome outcomes.
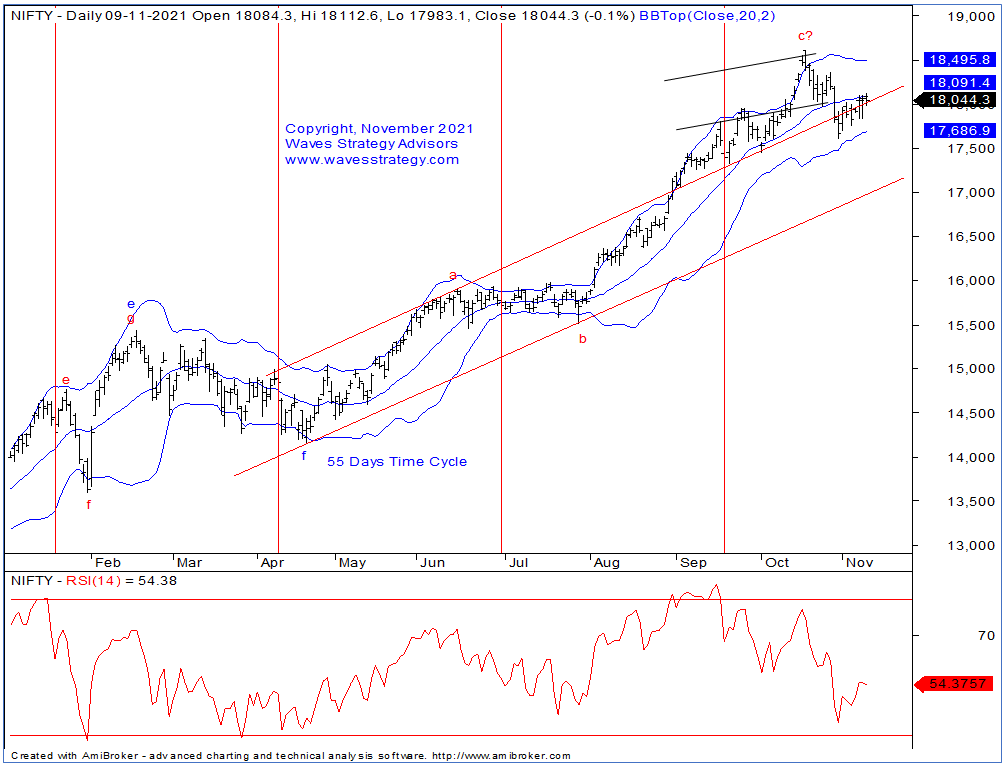
Nifty Daily chart:
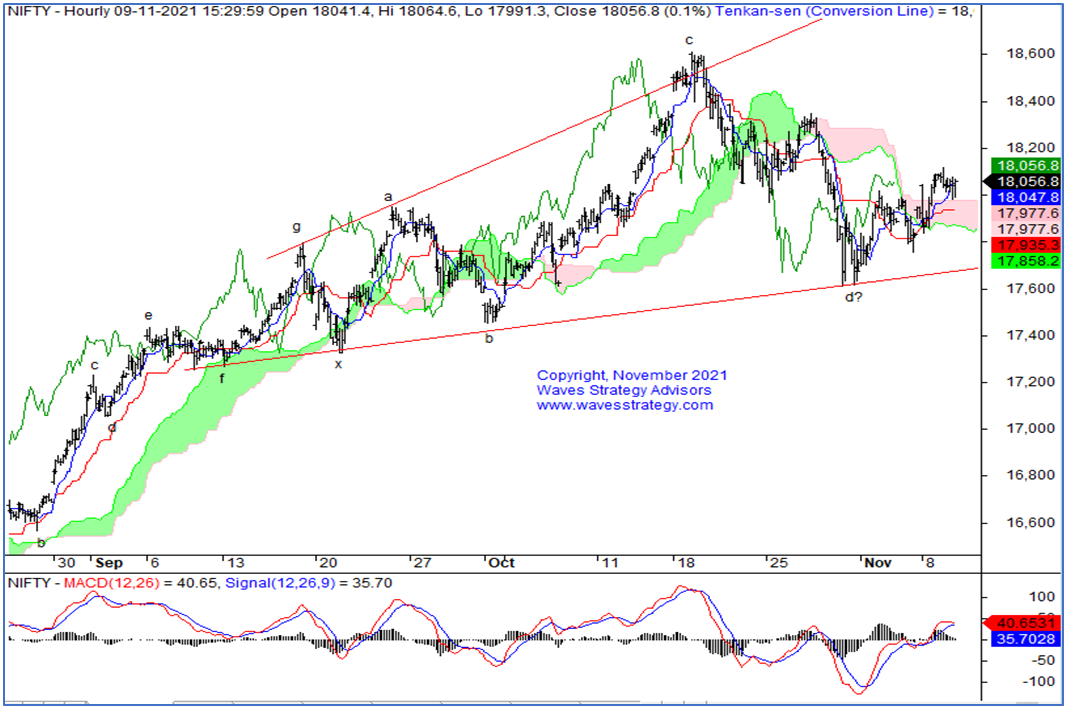
Nifty 60 mins chart:
Wave analysis:
In the last update we mentioned that, “closing above 18000 mark suggest bulls are trying to take control. Further move above 18087 level is required for a continuation towards 18200-18230 levels where it might find resistance again. Over near term, 18350 is very crucial on upside whereas 17836 is important support on downside.”
In the previous trading session, Nifty had a flat opening and made a high at 18112 levels in the first few minutes. Post that it failed to continue the upside momentum and moved in sideways to negative action throughout the day. By end of the day it closed with a minor negative note at 18044 levels.
Sector wise, flat action was witnessed among most of the indices in which Smallcap50 and Midcap50 continued to climb higher and closed on the positive note with 0.54% and 0.99% respectively. Auto sector was the top gainer with 1.03%. Stock action wise, out of top 5 gainers, 3 stocks were from auto sector which gained in the range of 1.27% to 5.24%. M&M was the highest gainer with 5.24%. On the losing side, private banks and NBFC space went through minor profit booking.
On the daily chart of Nifty, the structure since April 2021 suggest that minor wave g is ongoing within which we have witnessed subdivision in form of a-b-c till now. From the lows of 15513 level, minute wave c ran it course which has achieved 1.618 times near 18400 level. This wave c went higher till 18604 levels and post which sharp fall towards 17613 level was witnessed. This fall violated middle Bollinger bands for the first time which increases the odd that the trend may be reversing on the downside. Nevertheless, after the recent recovery from the lows, prices are struggling near middle bands which is as per polarity reversal. Moreover, in the previous session, we failed to see follow up buying above 18000-18060 level and formed a small bearish candlestick pattern. Thus daily close above 18100 level required to see further gains from hereon but momentum will play crucial role here.
On 60 mins chart, prices did form higher high higher low pattern however it is currently hovering near the downward channel resistance which is connecting recent highs. Hence, crossing above this channel resistance near 18100 level with strong momentum is must to see continuation of uptrend from hereon. At the same time, any move back below 17836 will provide the first sign that wave e of Neutral Triangle Pattern may be on the verge of completion. We will cite the next target levels based on breakout on either side as well as nature of the move.
In short, Nifty did take out 18000 mark however strong momentum is still missing. Daily close above 18100 will continue the journey towards 18200-18230 levels with 18350 as major hurdle whereas any move below 17836 will provide the first sign of weakness.
Want to ride the momentum for 8% to 10% target with prudent risk reward and clearly defined stoploss – Get access to Momentum calls more here
Nifty / Bank Nifty calls – Want to trade index on intraday or positional basis – check here
Mentorship on Timing the Markets: Mentorship starts in November that will ensure you become an Expert Trader with clear defined strategy, disciplined approach and science to forecast the markets. Time is the most essential element and we will provide over the period of 3 months all necessary tools required for one to become a profitable trader using Options. Simply fill the below form for more details OR Contact us on +919920422202.