Nifty Elliott wave path cannot be more accurate!
May 05, 2025
It is possible to forecast the market using the simple scientific method of Elliott wave.
Below chart was discussed during the weekly webinar with 1000’s of participants. Wherein, we anticipated a possible continuation of a fall in Nifty and then resumption of uptrend in form of wave (5).
Nifty Daily chart with Elliott wave Anticipated in December 2024 in Weekly webinar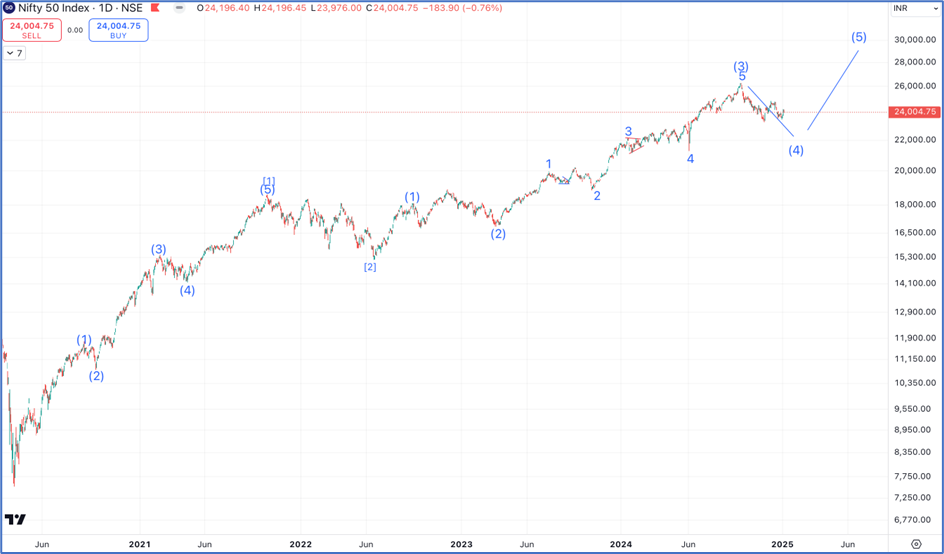 Nifty Daily chart happened as on 05th May 2025
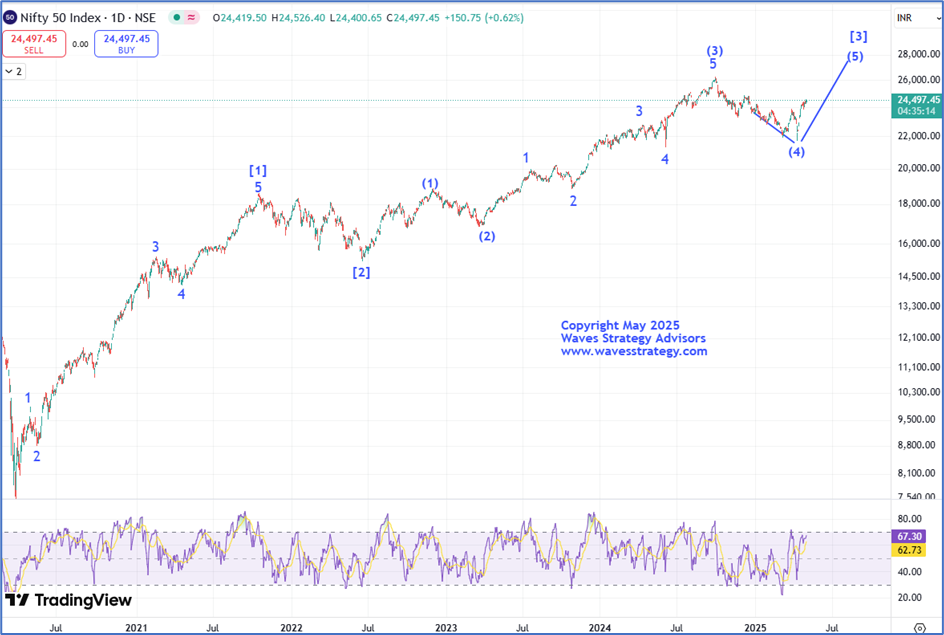 Nifty has been moving precisely the way we have been forecasting as per Elliott wave, and continued to work extremely well as expected. In the month of December 2024, we anticipated continuation of fall in form of wave (4) and expected it to get completed near 21800-22000 mark, and post which uptrend can resume in form of wave (5) and Bang on!
On the above chart, we can see that Nifty made a low of 21743 levels where wave (4) looks to have completed on the downside and Nifty has started wave (5) of [3] on the upside. As per guidelines, wave (5) usually retraces 1 time of wave (1). As per this, wave (5) might reach towards 27000 or to higher levels.
One needs to ensure to follow the rules of Elliott wave and Neo wave to trade with high conviction!
So, for now one should keep accumulating on dips as long as 23200 levels which is an important Gapp support area remains intact on the downside for medium to long term.
In a nutshell, by knowing the science of Elliott wave along with price action it is possible to form strong trading strategy right from short term intraday to positional investments.
Brahmastra (Mentorship) on Timing the market – Equip yourself with tools of Elliott wave, Neo wave, Time cycle, stock selection algo creation, multibagger and momentum stocks identification along with exact trade setup that actually works. Only a few seats left! Fill below form for more details.