Nifty Fibonacci Retracement, Elliott wave with Time cycle
Aug 07, 2023
Elliott wave is GPS of the market and this combined along with advanced technical analysis studies can give precise entry opportunity especially for Options Traders.
Time Cycle helps you identify optimal entry and exit points in the stock market
We derived path of Nifty much ahead on 05th August 2023 with 1000’s of participants during live webinar.
Below is the chart of Nifty on 15 minutes with 43 period Time cycle.
Nifty hourly chart (Anticipated on 5th August)
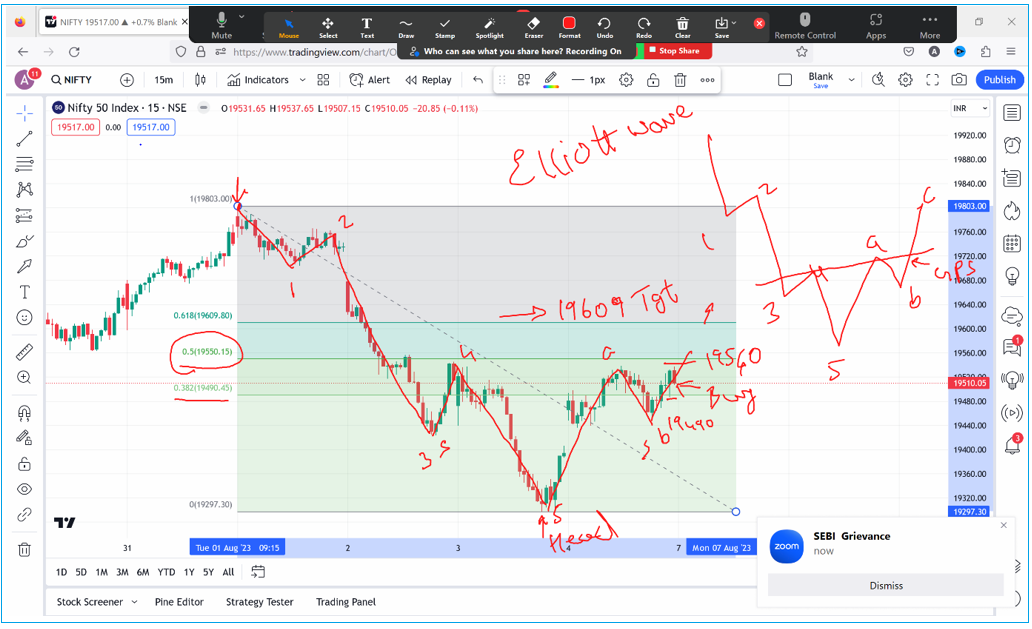
NIFTY 15 minutes chart (Anticipated on 5th August)

Nifty 15 minutes chart – Happened so far as on 7th August 2023

Elliott wave analysis – Nifty first chart showing inverted Head and Shoulder pattern along with Elliott wave counts. Fibonacci retracement of 61.8% was used to derive the 1st target which was at 19609 with initiate level above 19540 that too around the Time cycle mentioned below.
Time cycle - The above chart shows the time cycle of 43 period on a 15-minute scale. The vertical lines represent the area of the time cycle where short-term upward reversals can be observed. As shown in the first chart, we anticipated a move on the upside from 11am on 7th August Monday. Prices made a low exactly at that time near 19532 and reversed back on upside crossing above the intraday target of 19609 levels.
Happened – Nifty moved precisely as per the set blueprint. Prices made a low near 11am giving good opportunity for Option traders to buy calls or short puts and rushed towards the target of 19609. Also further positive break above 19620 will open Head & Shoulder target levels of 19800/
In summary, we can see how technical analysis pattern like H&S is combined with Elliott wave and Time cycle to give precise trading opportunity and setup. Trading Options can be easy if this science of technical analysis is known completely.
Become Market Wizard (BMW) – Is comprised of two modules – Options Trading Using Technical Analysis (OTTA) covering Open interest profile, Candlestick profiling techniques, Volume profile to see big players activity, 5 trade setups for Option buyers using KST and Bollinger Bands which is scheduled on 19th – 20th August 2023 and Master of Waves (Elliott wave, Neo wave and Time Cycle) on 16th – 17th September 2023. Limited seats only, Early Bird ends on 10th August. Fill below form for more details: