Nifty Ichimoku Cloud for Neo Wave Pattern Analysis
Feb 11, 2021
Ichimoku Cloud is a powerful Technical indicator that can be used independently as a complete system in itself for Trading.
Neo wave pattern recognition becomes extremely easy when we combine Ichimoku Cloud along with it. Below is a Nifty hourly chart that helps in identifying the Diametric pattern.
Nifty Hourly chart:
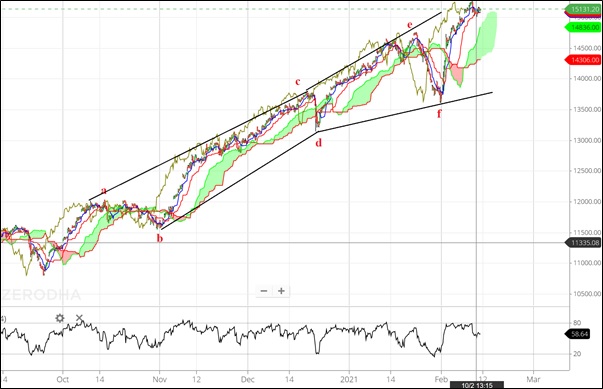
Elliott Wave analysis
In above chart we have shown running Diametric pattern. This is a Bow Tie pattern with contraction in the start and expansion in the later legs. With the application of Ichimoku Cloud one can see the pattern clearly. Whenever prices have moved below the cloud it indicates a change in the smaller degree wave. So we can see wave b after completion of wave a taking prices below the cloud. Later prices moved back above the cloud in the form of wave c. By this logic one can make out the subdivisions of the Diametric pattern in the form of a-b-c-d-e-f-g.
Do understand this is not a rule but only a guideline that can help new Neo wave practitioner to get an eye for the pattern. This advanced Elliott wave concept along with Ichimoku Cloud provides a very strong way of developing the overall context of the market and also to act as a signaling system.
Trade with an Edge using these advanced methods but in a very simple way. Mentorship of Technical Analysis starts on 13th March 2021 which will focus on things every trader should know with prudent volatility based risk management, money management strategies, Intraday to Positional Trade setups and much more. Register NOW here or Whatsapp on +919920422202