
Nifty Nearing a Crucial Lunar Cycle: Hurst Time Cycle & Elliott Wave Analysis
Aug 26, 2026
Advanced Elliott Wave analysis, particularly Neo Wave, when combined with Hurst time cycles and lunar cycles, can provide a useful framework for identifying potential turning points and trade setups from a short- to medium-term perspective.
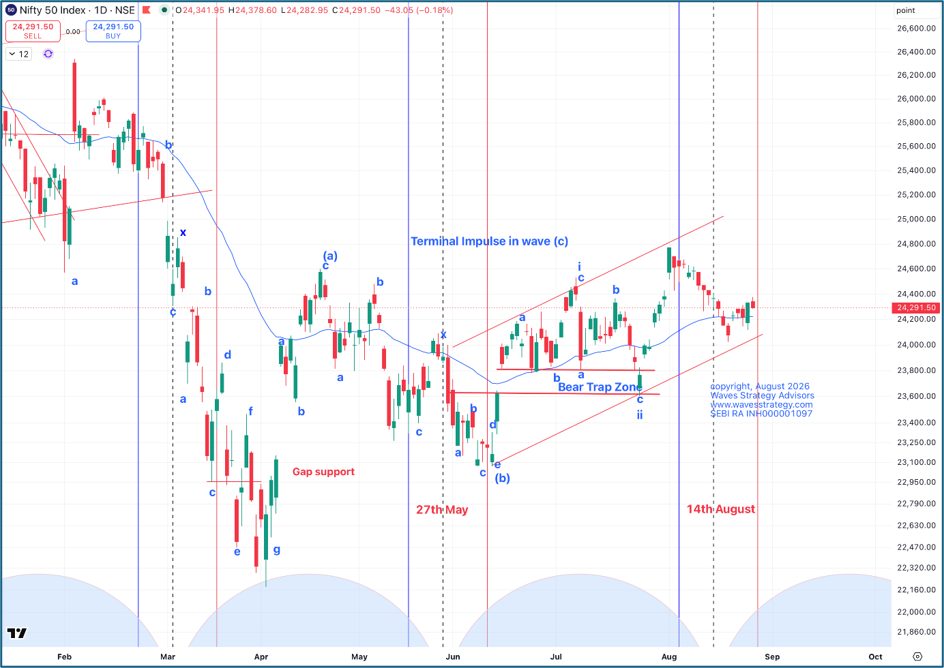
In the research below, we have highlighted the 55-day Hurst time cycle, represented by the mid-black line, along with the time zone marked by the blue and red lines. The red line represents the outer time boundary by which a potential market reversal is expected.
Interestingly, Nifty has already started showing signs of a short-term reversal on the upside.
Nifty daily chart:
Nifty hourly chart:
Nifty Breaks Above the Key Resistance Zone
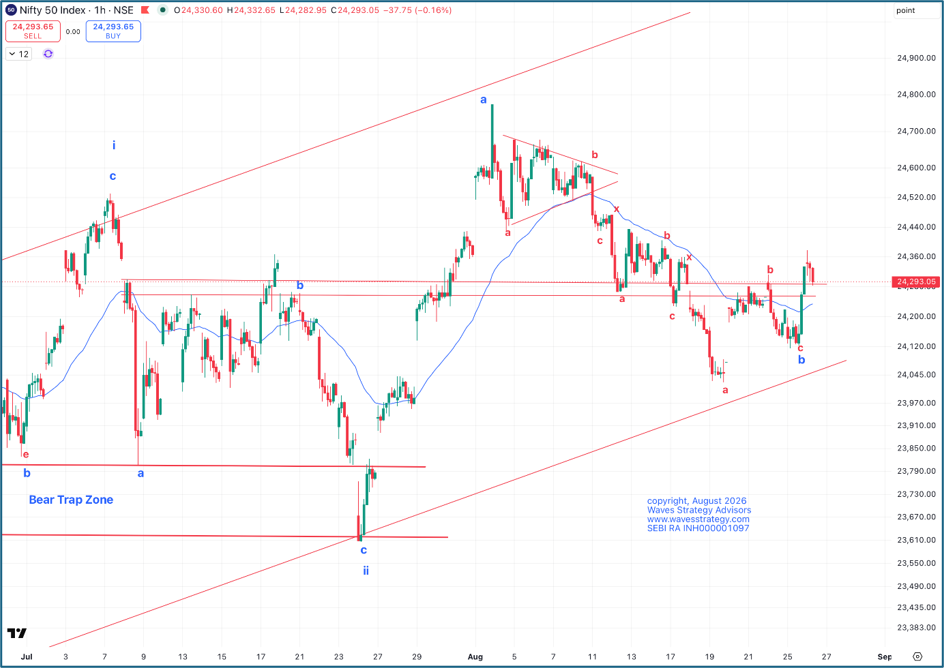
The Nifty 60-minute chart clearly shows that price has managed to break above the major hurdle zone of 24,220–24,280 and is now retesting this breakout area.
This retest becomes important because a successful hold above the zone could provide further confirmation of the ongoing reversal.
A significant portion of the market movement since 3 August, following the implementation of the CAS mechanism, has occurred through gaps or around CAS-related closing activity. Even yesterday, we witnessed a sharp upside move after the CAS-related market movement.
This has made the environment somewhat challenging for intraday traders, as a meaningful portion of the price movement is occurring outside the conventional intraday structure.
For positional traders, however, the setup remains more interesting, particularly as option pricing can start responding more meaningfully once the CAS-related activity subsides.
Volatility Expansion Could Become Important
We are also entering a phase where historical volatility is near its lowest levels in years.
Periods of extremely compressed volatility are often followed by volatility expansion. If this expansion develops as expected, it could create a more favourable environment for option buyers, particularly because implied volatility has also declined significantly.
Therefore, the combination of:
- Extremely compressed historical volatility
- Lower implied volatility
- A potential Hurst cycle turn
- Lunar-cycle confluence
- A developing Neo Wave reversal
makes the next few trading sessions particularly important.
From a price perspective, 24,180 remains an important downside support zone, while 24,550 and higher levels could become relevant on the upside if momentum continues to build.
Neo Wave Perspective
From the Neo Wave perspective, the entire preceding decline is being interpreted as Wave b within a triple corrective structure.
The current upside move is showing a faster retracement of the last falling segment. This is an encouraging sign and provides an initial indication that the structure may be transitioning toward an upside reversal.
However, strong momentum is yet to be established.
Therefore, the next few days of price action will be crucial in determining whether this reversal develops into a sustained move or remains a short-term bounce.
Lunar Cycle + Hurst Time Cycle Confluence
The lunar cycle provides another interesting layer to the analysis.
Historically, in our observations, Purnima has often coincided with an upside move over the following two to three sessions, while Amavasya has often coincided with downside movement over a similar period or longer.
The upcoming Purnima on 26 August is particularly interesting because it coincides closely with the Hurst time-cycle window.
The final red line in the Hurst cycle analysis falls around 27 August.
This creates an important time-confluence zone:
Purnima → 26 August
Hurst cycle window → 27 August
In other words, time is becoming synchronized, but price still needs to provide confirmation.
That distinction is important. A time-cycle confluence identifies a potential inflection zone; it does not, by itself, guarantee a reversal.
In a Nutshell
The current Nifty setup is interesting because multiple analytical frameworks are converging at nearly the same time:
Neo Wave + Hurst Time Cycle + Lunar Cycle + Volatility Expansion
The market has already crossed the important 24,220–24,280 hurdle, but sustained momentum is still required.
A successful hold above this zone, followed by increasing momentum, could open the possibility of a move toward 24,550 or higher.
On the downside, 24,180 remains an important level to watch.
The next few sessions should therefore be watched closely as time is indicating an inflection zone, while price is still in the process of confirming it.
Want to Learn These Methods in a Structured Way?
If you want to go beyond individual market forecasts and learn a systematic approach to analysing stocks and options, our Trishul Membership combines multiple technical-analysis techniques into one framework.
The program covers:
- Keltner Channel + KST applied directly to options charts
- Neo Wave for understanding market structure and forecasting
- Ichimoku Cloud for trend and momentum analysis
- Practical methods for analysing stocks and options
Trishul Membership — 3 Months
Limited seats are available.
Fill in the form below for more details.