
Nifty Near a Key Level: OI & Neo Wave Reveal the Next Move!
Sep 04, 2026
Advanced Neo Wave analysis when combined with price action can provide a useful framework for identifying potential turning points and trade setups from a short- to medium-term perspective.
Nifty Hourly chart with Neo Wave
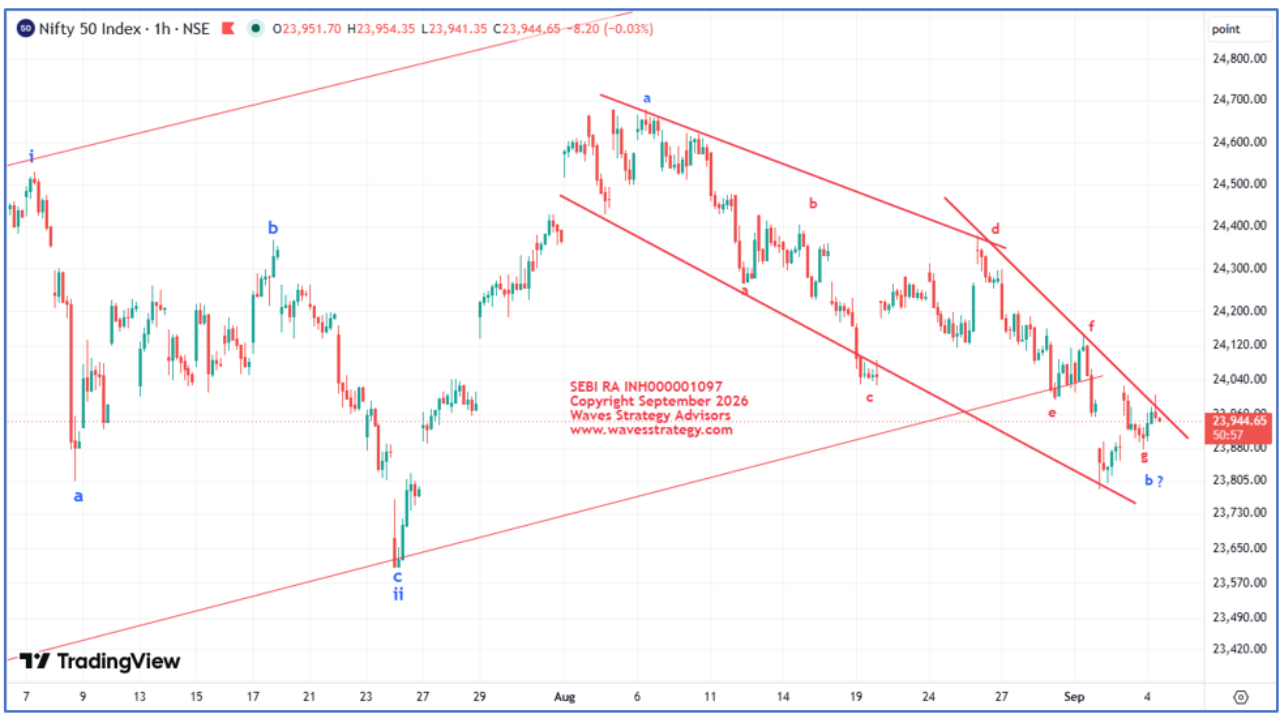
Nifty continues to remain trapped in a narrow range, with the index struggling to sustain a meaningful directional move. The ongoing consolidation reflects a lack of momentum, making it difficult to anticipate a breakout or breakdown at the current stage.
In such a phase, traders need to remain patient and wait for key levels to be breached before taking a directional view. From a technical perspective, the current price structure and wave pattern provide important levels to monitor for the next potential move. Let’s understand Neo wave perspective:
- From a wave perspective, the rise since July 2026 was unfolding as wave a (blue) which got completed around 6th August 2026.
- Since then, the decline has been developing in a Diametric pattern, as the corrective phase has taken more time compared with the preceding rise. A sustained move above 24,030 could potentially complete Wave b (Blue) on the downside and open the further up move ahead.
- On the other hand, a break below 23,850 would indicate continued weakness and could suggest further extension of Wave B (Blue) on the downside. Until either of these levels is decisively breached, Nifty is likely to remain range-bound between 23,850 to 24,030.
- In such a market environment, it may be more effective to focus on stock-specific opportunities rather than anticipating an early breakout in the index.
Now lets understand what OI profile is suggesting for index
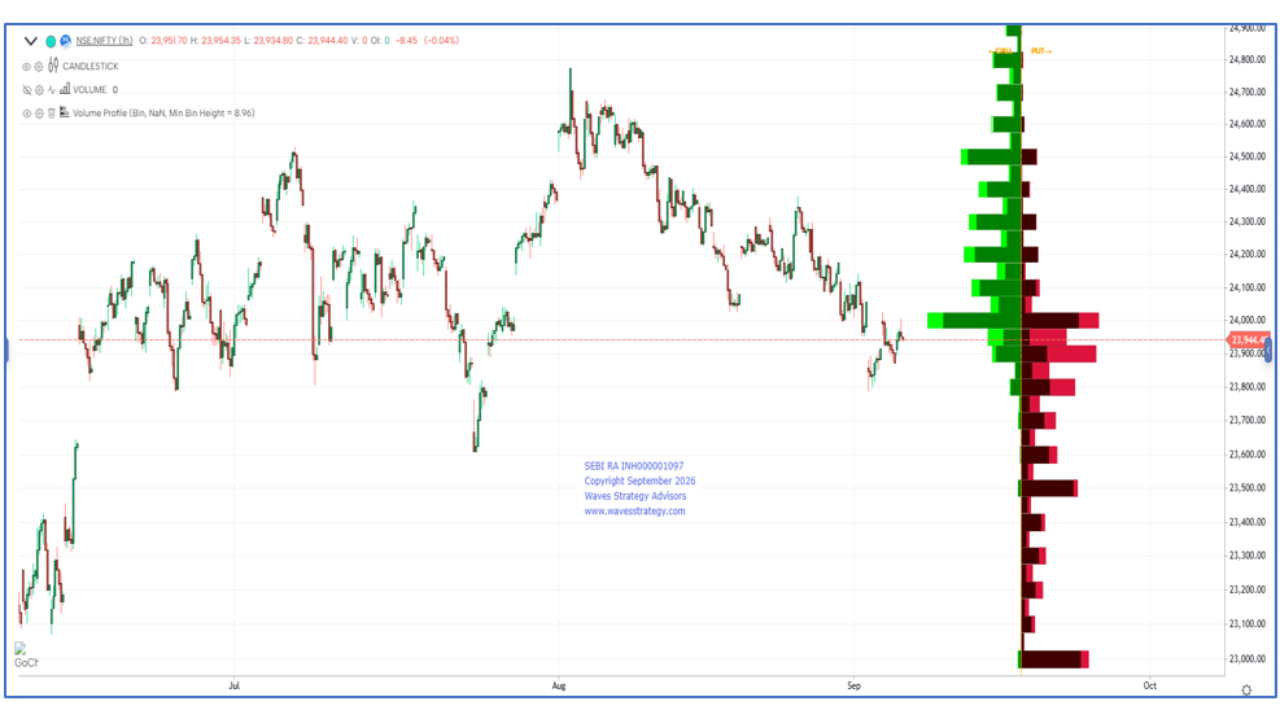
Nifty Hourly chart with OI profile
What is Open Interest?
- Open Interest represents the total number of outstanding contracts in a specific instrument at a given time.
- OI analysis can be used for both positional and intraday trading.
- It is generally viewed from the seller’s perspective as it helps identify the activity of big market participants.
- Here it can be observed that the 24000 strike has the highest OI on the call side indicating strong resistance near the same. For Nifty, to show any sharp move on the upside prices need to sustain above the same.
- On the downside, 23,800–23,900 Put OI provides an important support zone. A break below 23,850 can weaken the structure and increase downside pressure.
- The concentration of Call OI near 24,000–24,100 and Put OI around 23,800–23,900 suggests that option writers are currently keeping Nifty within a defined range.
Conclusion
- Overall, Nifty remains range-bound between 23,850–24,030, with the Neo Wave structure suggesting a decisive breakout is needed for the next directional move. A move above 24,030 can open the path towards 24,150, while below 23,850 can extend the downside. Until then, rather than anticipating an early index breakout, the focus should remain on stock-specific action, where clearer trends and opportunities can emerge.
Brahmastra (Mentorship) on timing the market using Hurst’s Time cycles along with Elliott wave, Neo wave, complete handholding & stock selection algo creation with access to traders community. A mentor can change the learning curve that can take years to a few months. Act now, Know More
Trishul (Options Mantra – Elliott wave – Neo wave) – Trading Options using science of Keltner channel, KST, Supertrend indicator and Price action along with volume profile with Neo wave analysis scheduled on 12th – 13th September & 10th – 11th October. Limited seats only. Fill below form for more details