Nifty Neo wave with Bollinger Bands, Why is it lethargic?
Oct 20, 2020Nifty Neo wave pattern suggests prices are in second corrective pattern and showing some tiredness. Nevertheless, the support levels are protected as of now which can keep broader trend in a range as of now with crucial resistance lying near 12050 – 12100 on upside and important support now at 11650 levels.
Nifty has continued to drift with no clear direction over past two weeks as prices are back in the zone seen during February 2020.
Nifty Neo wave pattern and Bollinger Bands
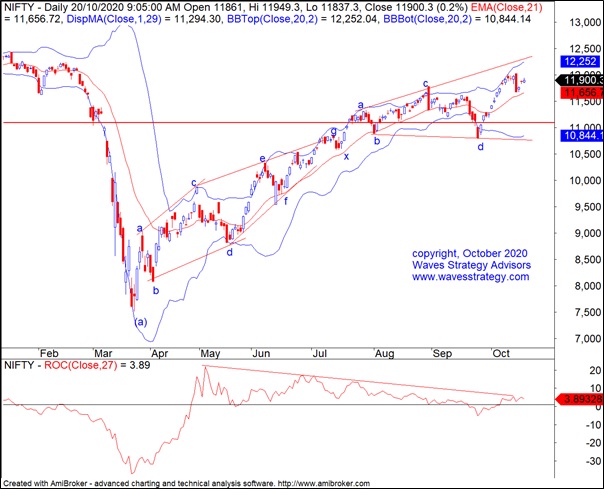
Nifty has continued to move higher slowly and steadily over past many months. The speed with which prices have been rising has slowed down and the same can be measured by looking at the Rate of Change indicator. The parameter for this indicator is selected to be as 27 which is half of the Time cycle periodicity of 55 days. This is the correct way of selecting any parameter for an oscillator. We can clearly see ROC has been slowly moving lower and recently even dipped below the 0 level when Nifty touched 10790 levels. However, prices are supreme and indicators only act as a warning sign.
Nifty Neo wave perspective: Prices have risen in the form of double corrective pattern and currently wave e either of an Expanding Triangle or that of a Diametric is ongoing. Immediate support is near 11650 levels and the top made near 12025 will be an important resistance. As long as these levels are protected we can see sideways drift since momentum is yet to pick up.
Bollinger Bands: During the entire rise we can see that a good trending move is observed as long as prices sustain above the middle of the band and oscillates between the mid and the upper band. It tried to break below the lower end of the band during the fall in form of wave d but next day moved back above the same. This method helps to stay in direction of trend unless there is a reversal confirmation. The middle of the band is near 11650 and so a close below it will indicate that we are heading back towards the lower end. But as long as 11650 is protected current wave e can continue to move in lethargic fashion and test the patience of traders.
In a nutshell, Elliott wave method combined with Bollinger Bands and ROC indicator gives the overall context of the market and range bound move between 12100 – 11650 can be expected. Move below 11650 will suggest wave e is over and a bigger downtrend is resuming or wave f of Diametric pattern is starting. For exact signalling method and volatility based stops one should apply methods like ATR, Ichimoku Cloud in addition to above.
3 Months of Technical Analysis starts in November 2020. It is not always your entry which results into the losses but timing the exit is all the more important. How to exit, position size, combine multiple methods to understand the risk before pulling the trigger is what will make you a profound and successful trader. In this mentorship learn the step by step scientific approach to trading. Let us make it happen together! Early Bird Ends on 25th October 2020. For more details whatsapp / call on +919920422202 or Fill the form below