Nifty: Bang On using Neo Wave and Price indicator
Aug 02, 2023
Neo wave along with simple price indicator helps to form powerful setups with a good accuracy.
We published the following research on 2nd August, 2023 (pre-market) in – The Financial Waves short term update.
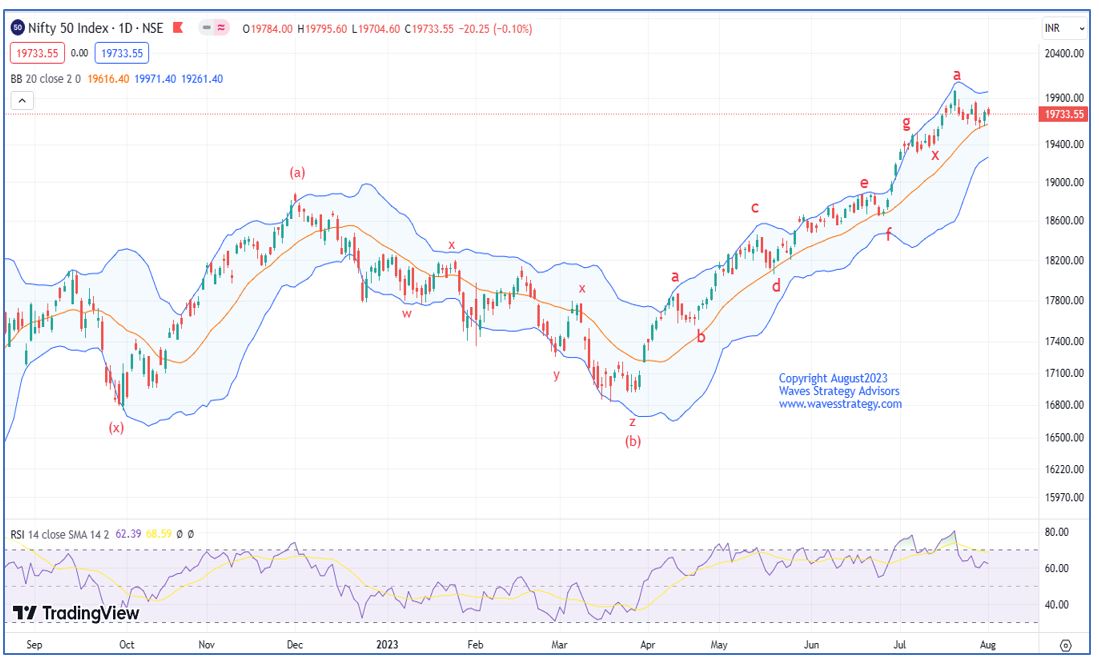
Nifty Daily chart as 2nd August 2023 (Anticipated)
Nifty 60 mins chart 2nd August 2023 (Anticipated)

Wave analysis as on 2nd August 2023:
After a sharp recovery, in the previous session Nifty witnessed a consolidation. The market started the day with marginal gains but witnessed profit booking in the initial hours and remained rangebound during the day.
On the daily chart, we have shown Bollinger Bands. Wherein, we can see that prices have bounced back from mid bands. Also, Gann level of 19952 is acting a major hurdle. Post completion of wave a at the top we are seeing stock specific action but everything looks to have slowed down. With Lunar cycle - Pournima on 2nd August we can expect a trending move to emerge. Decisive break above 19830 will result into retest of Gann 19952 on upside whereas on downside 19600 is important support. As of now this is intraday traders market and break below 19700 can take prices to 19640 over short term but since we are seeing whipsaw movement it is best to sell options as of now as long as the broad range of 19600 - 19830 remains intact.
On the hourly chart, Adx is trading near 9 suggesting lack of momentum which often results into sideways action or range bound movement.
In nutshell, Nifty is moving in a lacklustre fashion. prices are forming triangle pattern and breakout can be seen soon. For now, any move above 19830 is must for uptrend to resume. While on the downside nearest support is near 19700 levels. Any breach below 19700 can drag the price lower towards 19640 followed by 19600 levels.
Happened:
Earlier Nifty was trading in a range. However, after giving a break below 19700 prices not only achieved our target of 19600 but also made a low of 19519 which is way below from our mentioned levels.
This clearly shows that by combining price action and indicators one can easily identify wave patterns which works like magic!
Equity Research report – Subscribe to daily equity research report “The Financial Waves Short Term Update” and get detailed research on daily basis using Neo wave, Time cycles and 3 stocks that provides good trading opportunity with charts and explanation. This is the best way to see application and learn the Time tested methods. Subscribe annually and get monthly research free with medium to long term forecast on Nifty, Bank Nifty, Crude, Gold, Stock and much more – act now over here
Become Market Wizard (BMW) - Learn Options Strategies with KST Indicator, Open Interest Profile, Volume profile to see big players activity in Options Trading Using Technical Analysis (OTTA) scheduled on 19- 20 August 2023 and combine that along with Elliott wave, Neo wave and Time cycles on 16th – 17th September 2023. This will change the way you ever trade the markets. Fill below form for more details