
Nifty at Crucial Levels — Watch Open Interest Before the Next Move!
May 27, 2026
Nifty Open interest analysis with price action is one of the best method that can be used to identify the key reversal areas and price action support and resistance zone.
Options trading involves understanding momentum, trend, time decay, and market range. Hence, interpreting Open Interest (OI) data correctly becomes crucial for identifying market direction and key trading levels.
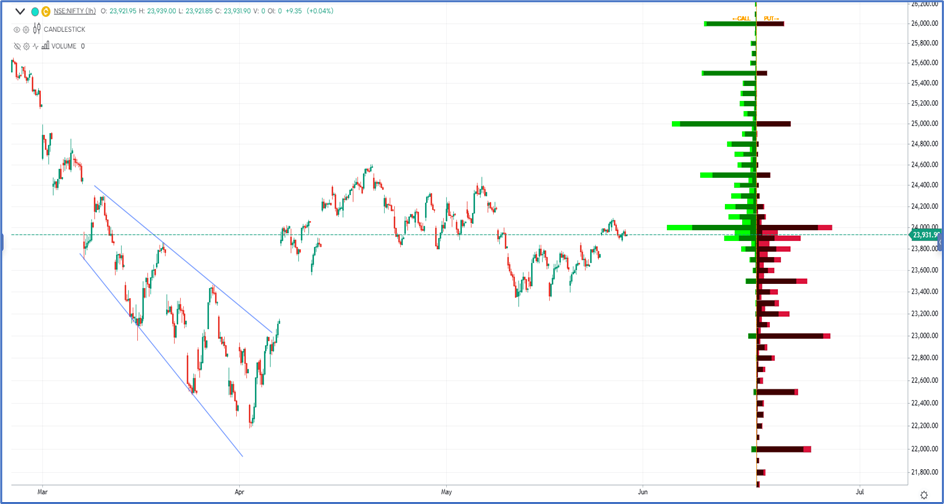
Nifty Hourly Chart with Open interest
What is Open Interest (OI)?
- Open Interest represents the total number of outstanding contracts in a specific instrument at a given time.
- OI analysis can be used for both positional and intraday trading.
- It is generally viewed from the seller’s perspective as it helps identify the activity of big market participants.
Understanding the OI Chart Structure
- The left-side green build-up indicates changes in Call Open Interest.
- The right-side data represents Put Open Interest positions.
- These OI levels help traders identify important resistance and support zones in the market.
Interpretation of OI
- The highest Call Open Interest build-up is visible around the 24000–24100 strike zone.
- This suggests aggressive Call writing by option sellers, making this area a crucial resistance zone.
- Until Nifty gives a decisive breakout above this range, upside momentum may remain capped.
- Strong Put Open Interest is visible near the 23800 and 23900
- This indicates Put writers are actively defending lower levels, creating a near-term support base.
- Current OI positioning suggests the market is trading in a broad range between 23700 and 24000. Both Call and Put writers are active, indicating lack of aggressive directional conviction for now.
In a nutshell
- Open Interest analysis simplifies options trading by highlighting the positioning of big players. Traders can build strategies by tracking support, resistance, and possible breakout zones through the OI profile.
- A decisive move above 24000 may trigger Call short covering, potentially pushing prices higher to 24100- 24120, while 23800 remains an important near-term support.
Brahmastra Mentorship – Advanced Market Timing
Time the market to the very day, hour, and minute using a powerful combination of:
- Elliott Wave & NeoWave
- Hearst Time Cycle Analysis
- Stock Selection Algorithm
- Practical Risk & Money Management
Brahmastra – 3-Month Mentorship Program
- Learn structured market timing techniques
Fill the form below to know more