
Nifty Bold Elliott wave Forecast with 55 Days Hurst’s Time cycle!
Aug 19, 2026
Nifty Hurst’s Time cycle suggesting that prices have arrived at crucial 55 days Time zone. Time is the heartbeat of market and price action follows.
Advanced Elliott wave – Neo wave provides forecasting ability and possible reversal areas when combined with Fibonacci retracement support levels.
Trader needs to identify Area of Significance (AOS) where multiple Price time techniques are in sync.
Below is detailed research on different time frames on Nifty chart
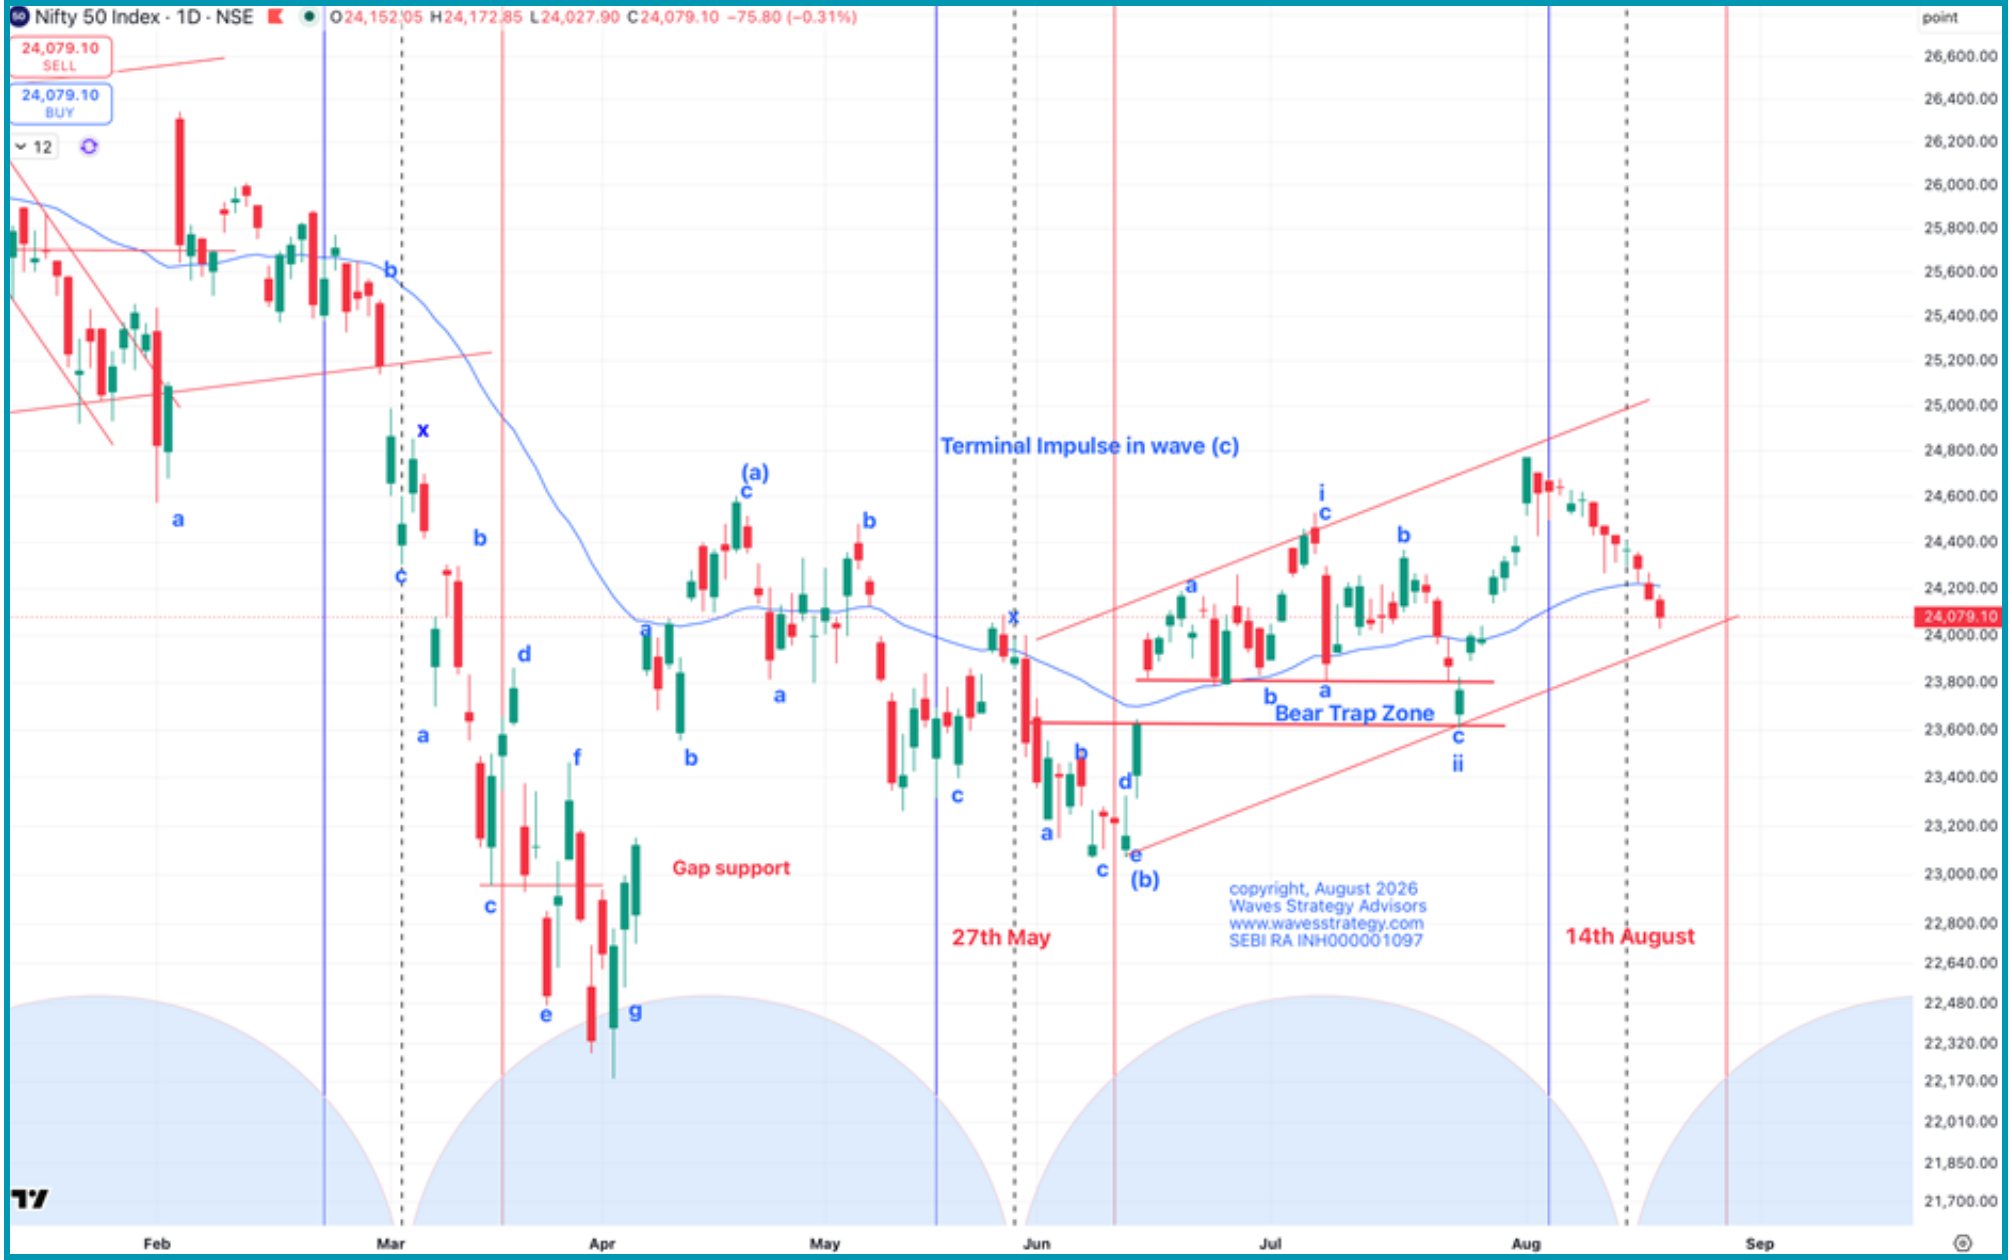
Nifty 55 Days Time cycle daily chart:
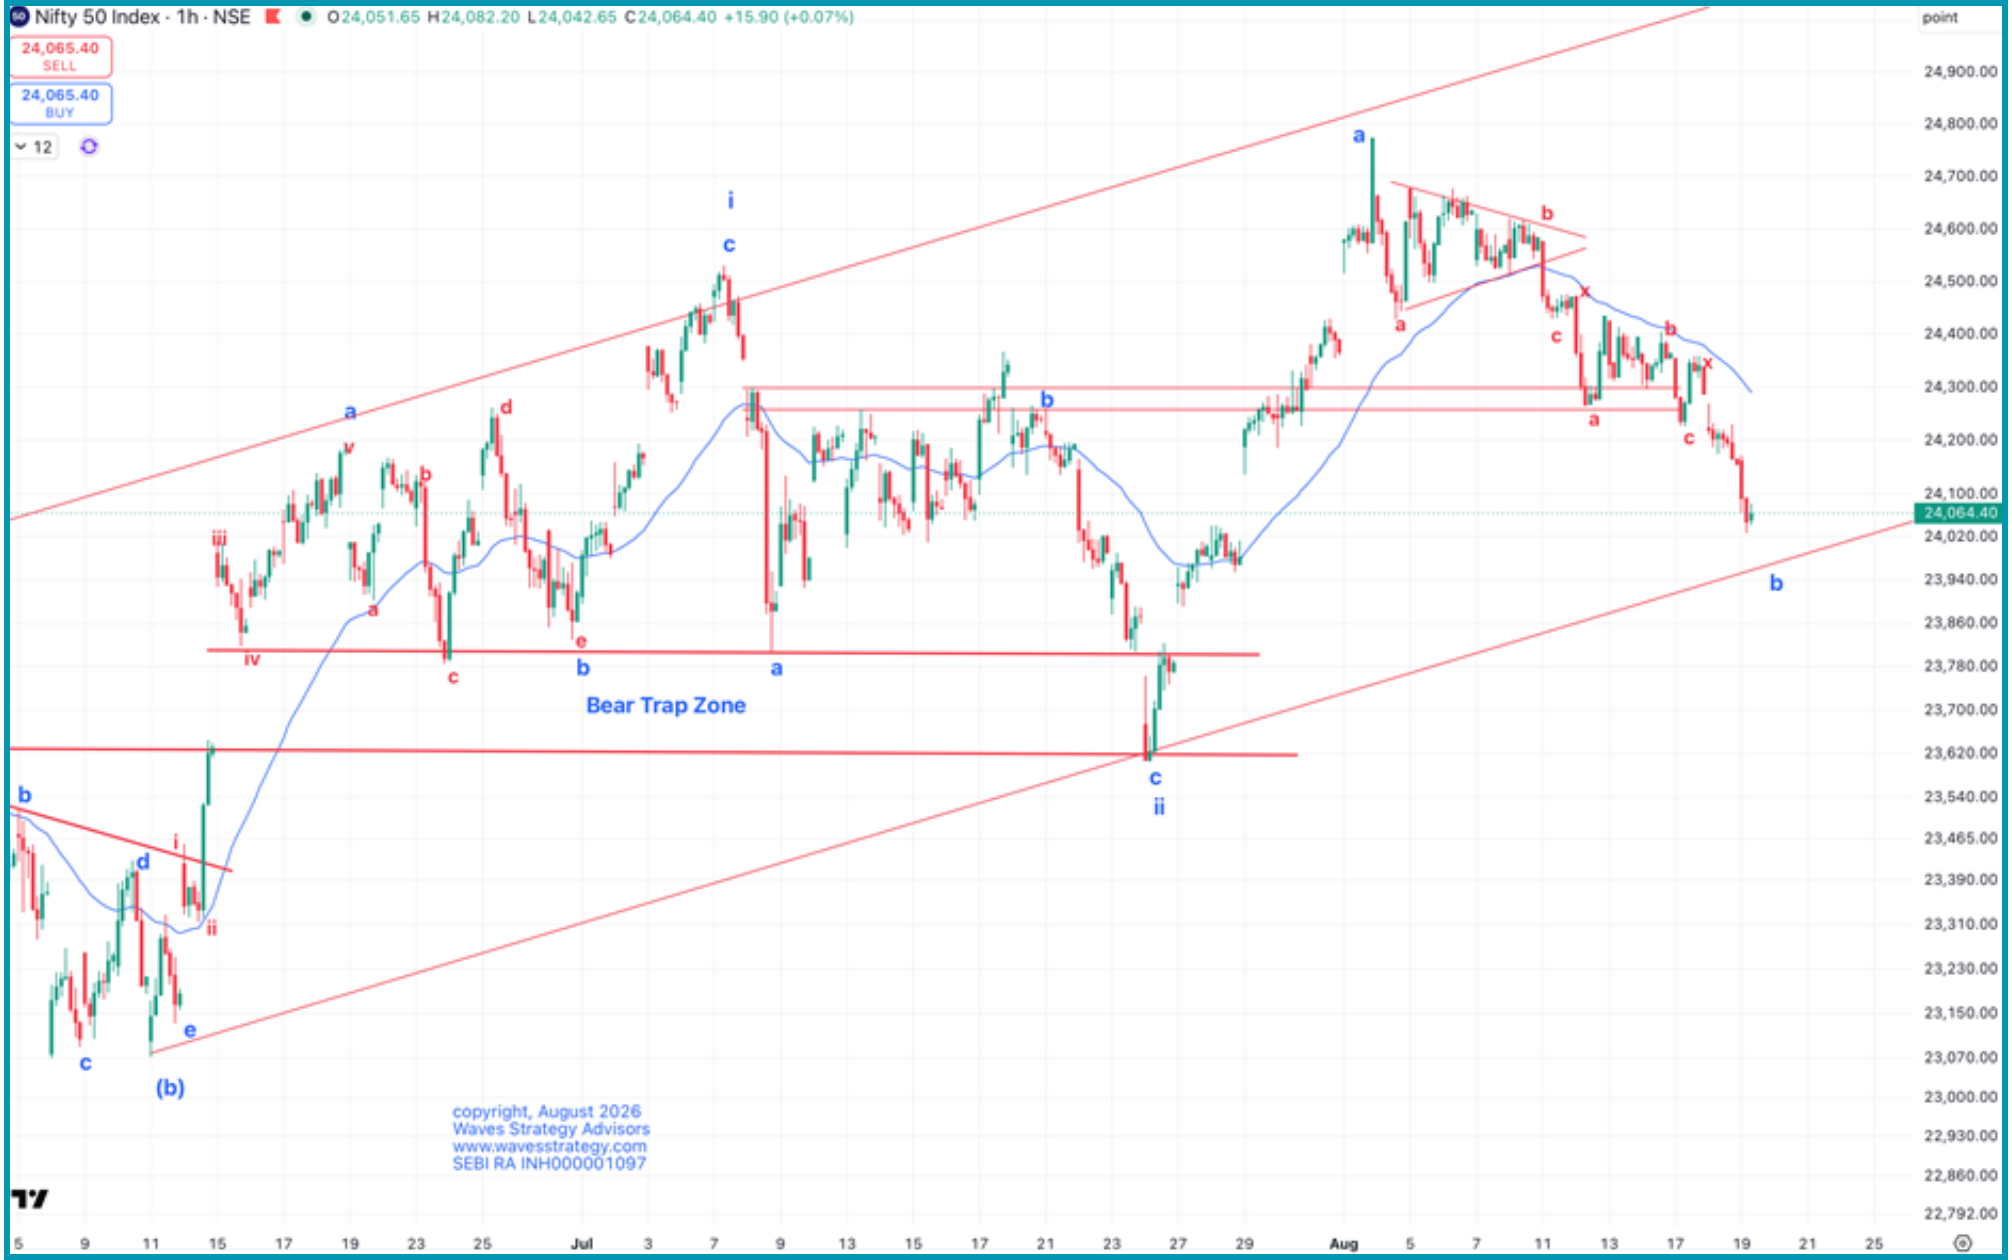
Nifty Hourly chart:
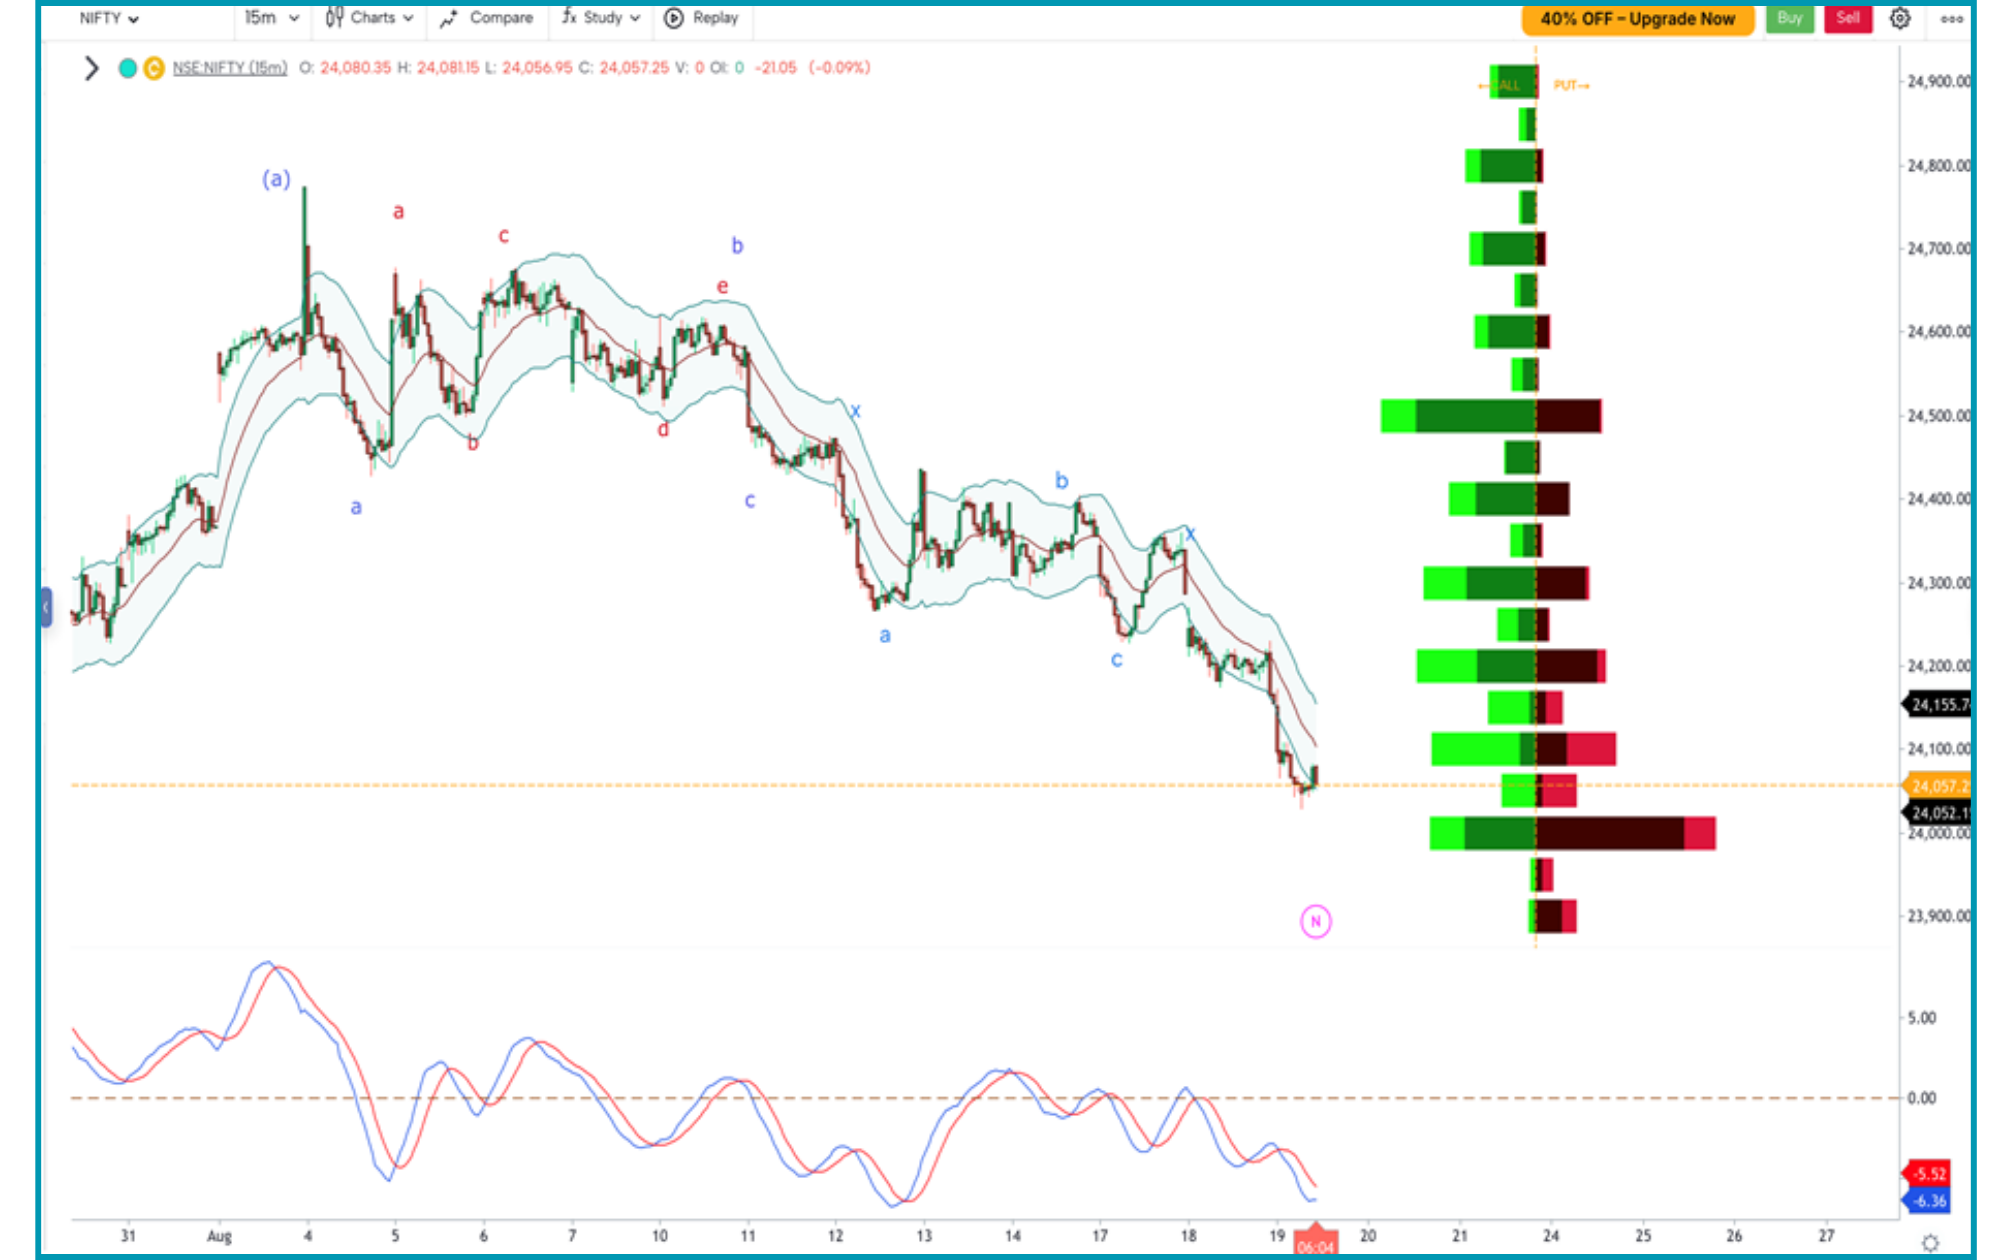
Nifty 15 minutes chart with OI profile:
Elliott wave analysis:
Nifty daily chart shows that prices post completing the low at 22200 levels in the month of April 2026, is moving up in the form of corrective pattern. Prices are probably forming Flat correction with wave (c) of primary degree ongoing.
This wave (c) is possibly forming a Terminal impulse pattern and we are seeing move on downside in the for of wave b of iii. The short term channel support is near 23970.
55 Days Hurst’s Time cycle – We can see that prices have tendency to reverse up from this cycle zone on multiple occasions. We are again in this zone and so Time is supportive for the up move. However, price action is still awaited.
It has been 12 trading sessions since prices have not closed above prior day’s high. This is simplest way of trading using 3 candlestick rule.
Nifty hourly chart shows internal Neo wave pattern. Prices are in wave b which is subdividing into complex corrective pattern involving “x” waves. Faster retracement above last falling segment which is near 24230 will provide 1st stage confirmation that the low is in place. Until then avoid buying and wait for price action to confirm.
Nifty 15 minutes chart with Keltner channel & KST – Options are powerful instruments if one understands the mathematics behind it. Open interest profile along with Keltner channel on price chart and KST indicator below it is classic combination to catch reversals early on. In the entire fall prices have failed to sustain above the upper Keltner channel & KST momentum indicator is yet to reverse up.
OI profile shows supporting activity near 24k by put sellers but we are yet to see meaningful increase in big players activity.
Closing Auction Session (CAS) – Already market is nervous due to CAS and volumes in Options on Sensex has dried out.
In a nutshell, Time is turning on upside but price action above 24230 is awaited for reversal. Best trade setups are when both Price and Time get in sync providing low risk high reward setup. Immediate support is neat 23970 & break above 24230 will provide positional trade setup. Any close below 23970 will continue the pressure on index till 23790 zone.
Brahmastra (Mentorship) on timing the market using Hurst’s Time cycles along with Elliott wave, Neo wave, complete handholding & stock selection algo creation with access to traders community. A mentor can change the learning curve that can take years to a few months. Act now, Know More
Trishul (Options Mantra – Elliott wave – Neo wave) – Trading Options using science of Keltner channel, KST, Supertrend indicator and Price action along with volume profile with Neo wave analysis scheduled on 12th – 13th September & 10th – 11th October. Limited seats only. Fill below form for more details