Nifty Option Trading with the Help of Open Interest Analysis
May 28, 2025
Nifty volume profile shows big players activity both from positional and intraday perspective.
Options Trading with Open Interest and Volume profile is one of the classic ways to trade.
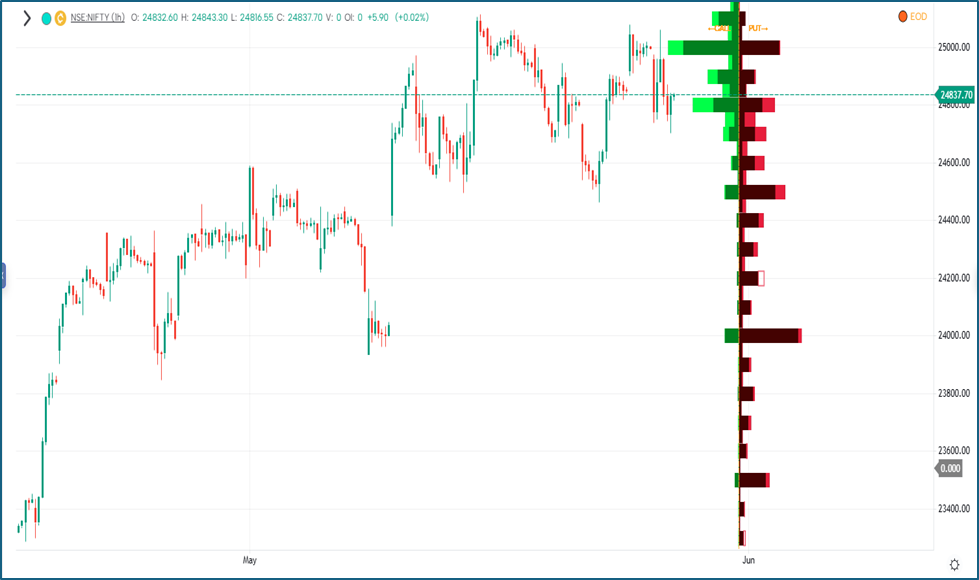
Nifty Hourly chart with Open Interest analysis
 Options Trading requires understanding of momentum, trend, time to expiry and range.
Open interest - showcases the total number of outstanding contracts for a specific asset at any given time. This analysis can be used for both Positional and Intraday basis and Open Interest is always viewed from the seller’s perspective as it helps to understand the big players activity.
As shown on above chart, the left side green buildup is suggesting change in Call open interest and right-side shows put open interest. Nifty for the past few sessions has been trading in a sideways fashion in a range of 24728 to 25050 levels with high volatility. As we can observe, open interest has increased on the call side near 25k mark and recently the Index made multiple failed attempts to close above the 25k territory which makes it an important hurdle for the Index to cross. For now, a break above 25050 levels can lead to call sellers to panic post which up move can resume. Until then, we can expect prices to trade in the above-mentioned range.
In a nutshell, Option Trading can be made easier by using these simple methods of analysis, one can clearly form option strategy in direction of big players by looking at Open interest profile. It is also crucial to know strike price selection to make the most of the trending move.
Trishul Membership – Options Trading with Elliott wave, Neo wave, Ichimoku cloud, and sacred science of trading & forecasting is covered in the Trishul membership program scheduled on 7th - 8th June & 12th - 13th July, Fill out the form below for more details