
Nifty: Open Interest & Volume Profile — The Next Setup Ahead!
Sep 02, 2026
Open interest analysis combined with price action is one of the best technical analysis methods that can be used to identify the key reversal areas and Support & Resistance zone.
Check out the research below on Nifty using Open Interest and KST indicator
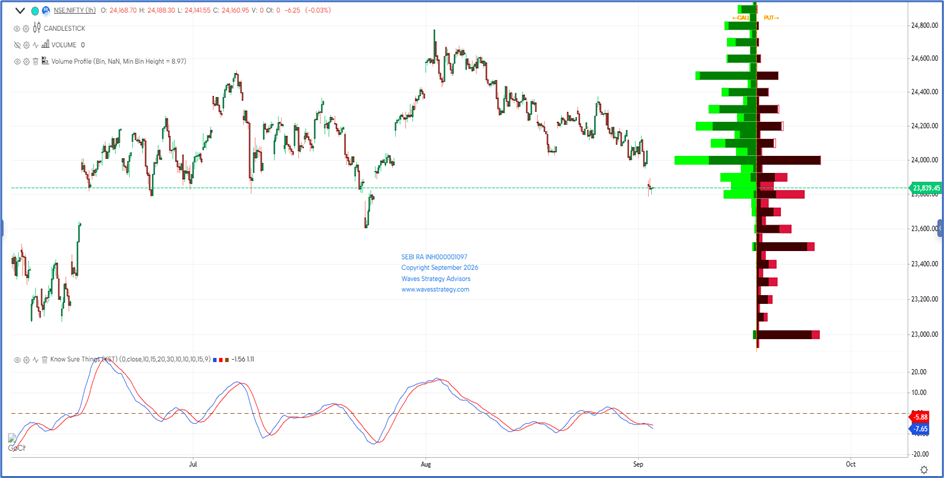
Nifty Hourly chart with Open Interest & KST Indicator
What is Open Interest (OI)?
- Open Interest represents the total number of outstanding contracts in a specific instrument at a given time.
- OI analysis can be used for both positional and intraday trading.
- It is generally viewed from the seller’s perspective as it helps identify the activity of big market participants.
Understanding the OI Chart Structure
- The left-side shows green build-up which indicates changes in Call Open Interest.
- The right-side of the data represents Put Open Interest
- These OI levels help traders identify important resistance and support zones in the market respectively.
Analysis using OI
- The highest Call Open Interest build-up is visible around the 24000-strike
- This suggests aggressive Call writing by option sellers, making this area a crucial resistance zone.
- Unless Nifty gives a decisive breakout above this range, upside momentum may remain capped.
- On the downside, strong Put Open Interest is visible near the 23500 and 23800 strike.
- This indicates Put writers are actively defending lower levels, creating a near-term support base.
- Current OI positioning suggests the market is trading in a broad range between 23800 and 24000. Both Call and Put writers are active, any break below 23800 may drag index towards 23500.
KST Indicator
- The KST (Know Sure Thing) Indicator is a momentum-based
- When the KST line crosses below the Signal line → Early sign of bearish momentum
- When both moves below the zero line → Confirms bearish momentum
- On the above chart, KST line has already crossed below the signal line and is trading below zero line.
Conclusion
- Open Interest analysis simplifies options trading by highlighting the positioning of big players. Traders can build strategies by tracking support, resistance, and possible breakout zones through the OI profile.
- For now, avoid buying and use pullbacks to sell for better risk reward as long as 23980 remains intact, a move towards 23700 can be expected.
Brahmastra (Mentorship) on timing the market using Hurst’s Time cycles along with Elliott wave, Neo wave, complete handholding & stock selection algo creation with access to traders community. A mentor can change the learning curve that can take years to a few months. Act now, Know More
Trishul (Options Mantra – Elliott wave – Neo wave) – Trading Options using science of Keltner channel, KST, Supertrend indicator and Price action along with volume profile with Neo wave analysis scheduled on 12th – 13th September & 10th – 11th October. Limited seats only. Fill below form for more details