Nifty Options Trading using Volume Profile, Catching Reversals!
Aug 03, 2023
Nifty volume profile shows big players activity both from positional and intraday perspective.
Options Trading with Bollinger Bands and KST indicator with outlook on Volume profile is one of the classic way to trade.
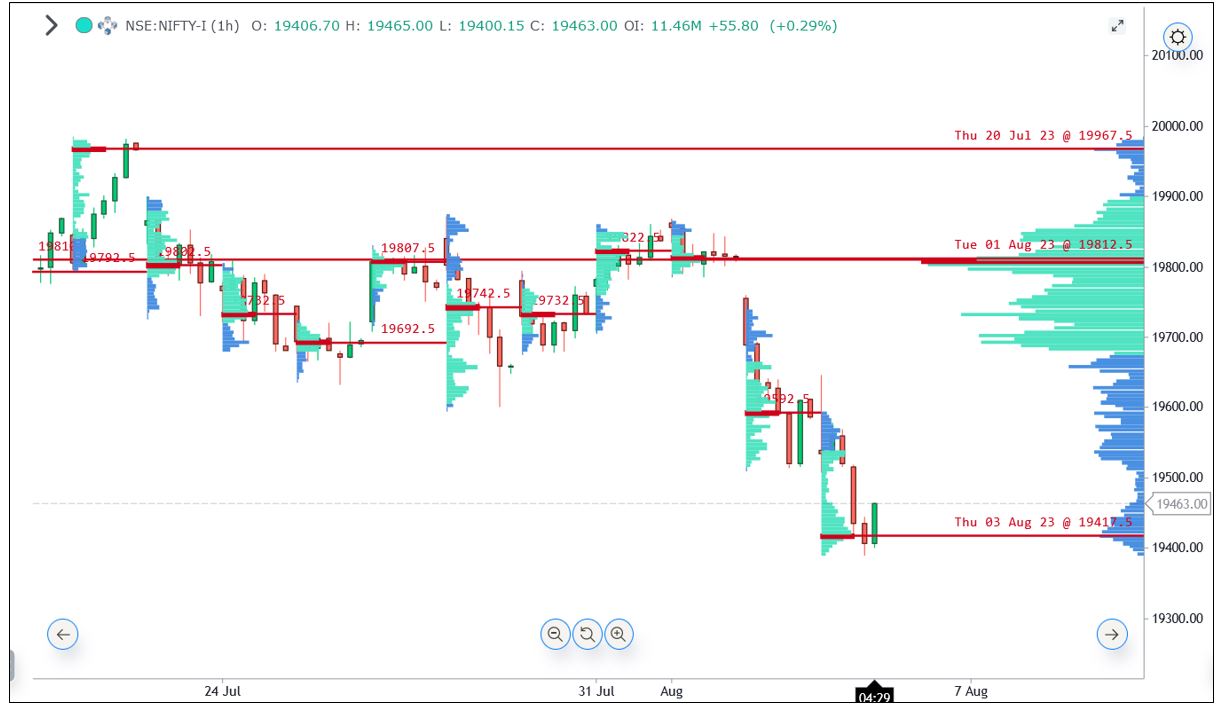
Nifty hourly Volume profile -
Nifty 19500 Put Options 15 minutes chart

Nifty Volume profile measure volume taking place at that price point which is different than the volume taking place on a specific day. The 1st chart shows both cumulative volume and intraday volume.
Cumulative Volume profile – shows distribution near 19800 levels which recorded highest volume. Break below the support level of 19700 (fut) confirmed that the volumes were indicating distribution by big players. Going forward crossing above it is going to be difficult task as these players will defend their positions.
Session Volume profile – this is intraday volumes and can be seen along with candlestick chart. As can be seen highest volume on 3rd August took place near 19420 (Fut) levels or 19320 spot levels. This shows that traders are creating fresh positions around this level of 19320. Now a break above resistance will suggest price reversal confirmation.
Options Trading combining this information with Bollinger Bands and KST – By knowing the activity of traders it becomes easy to trade Options. As shown on 2nd chart Nifty 19500 put options showed a strong break above the Bollinger Bands and this was accompanied with KST indicator crossing above 0 line. KST indicator give insight into momentum which is most important for Options Trader. Prices moved from 130 to 280 levels in less than 2 days. This breakout on put options above 130 was accompanied by breakdown on Nifty futures from high volume node.
In a nutshell, Options Trading by understanding volumes along with Bollinger Bands and KST breakout technique can be a powerful trading strategy especially for Options buyer. Now that huge volume occurrence on intraday near 19320 (spot) level has happened, confirmation on Bollinger Bands directly on Options chart can provide reversal trade setup.
Become Market Wizard - Learn to Trade Options by combining these techniques of Volume profile, Open Interest profile, Candlestick patterns and Bollinger Bands along in upcoming Options Trading using Technical analysis (OTTA) scheduled on 19th – 20th August 2023. Combine this with Elliott wave, Neowave and Hurst’s Time cycles in Master of Waves (MOW) on 16th – 17th September, Limited seats only, Early bird ends on 8th August. Fill below form for more details: