Nifty Options Trading using Neo wave and KST indicator
Jul 31, 2023
Options Trading require understanding of the overall market trend along with possible path that prices can traverse.
Especially for Option buyers knowing if the momentum is going to pick up is crucial as there is race against time.
Advanced Elliott wave – Neo wave provides the future forecasting ability and KST indicator helps to understand if momentum is about to increase.
Nifty hourly chart:
Nifty 5 minutes chart: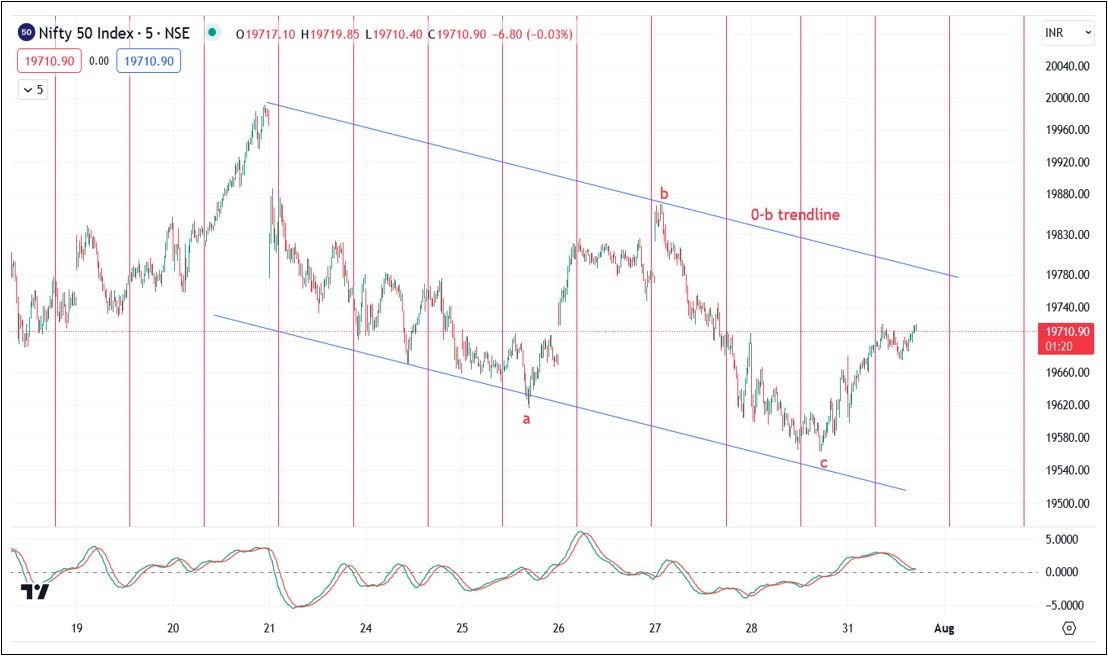
Neo wave has newly identified patterns like Diametric, Extracting Triangle, Neutral Triangle. These patterns are very common across Equity markets.
Nifty rise from the lows of 17060 is in form of Diametric pattern which got completed near 19520 levels. This wave g was exactly equal to that of wave a which is defined as per Diametric guidelines.
Using Fibonacci projection and retracement helps to understand targets for ongoing pattern.
Post completion of Diametric pattern at the highs of 19520 prices moved in form of corrective x wave. This x wave connects two standard pattern together. The next ongoing pattern can be either a Triangle, Flat or Diametric. Key is to understand the internal structure of ongoing leg to trade the next wave. So we drill down to see internal structure of ongoing wave b.
Nifty 5 minutes chart: Nifty 5 minutes chart shows internal pattern of the a-b-c correction post completion of wave a at the top. As per Neo wave prices completed the fall in form of wave c and showed bounce back in form of wave d. As the rise is slower the best way to trade this positionally is selling Options.
Options Strategy – Options are simple powerful instruments if one can understand the basic mathematics. Trading Options basis of the pattern of Neo wave is simply classic and can provide opportunity in any and every market scenario.
In above case as we can see the rise is slower so this is wave d of bigger degree wave b. During such case one can buy call options and sell multiple lots of OTM call options. This is called as ratio spread. In this case if prices move down there will be minimal or no loss, if prices move up slowly ITM call option will be giving money and OTM call option will continue to deteriorate.
The above is possible only after knowing the future expectations as per Neo wave.
In a nutshell, trading options can be easy if one can determine the future probable path using concepts of Elliott wave, Neo wave or Time Cycles.
Become Market Wizard (BMW) - Learn Options Strategies with KST Indicator, Open Interest Profile, Volume profile to see big players activity in Options Trading Using Technical Analysis (OTTA) scheduled on 19- 20 August 2023 and combine that along with Elliott wave, Neo wave and Time cycles on 16th – 17th September 2023. This will change the way you ever trade the markets. Fill below form for more details: