Nifty: How to identify Right Trading Strategy
Feb 12, 2020Technical analysis is all about trying to find out the best fit or methods that are currently working in the markets. There are various methods from the basic support and resistance level identification to the complex patterns of Elliott wave- Neo wave and Time cycles. I believe in combining anything and everything that can help in increasing the trading accuracy.
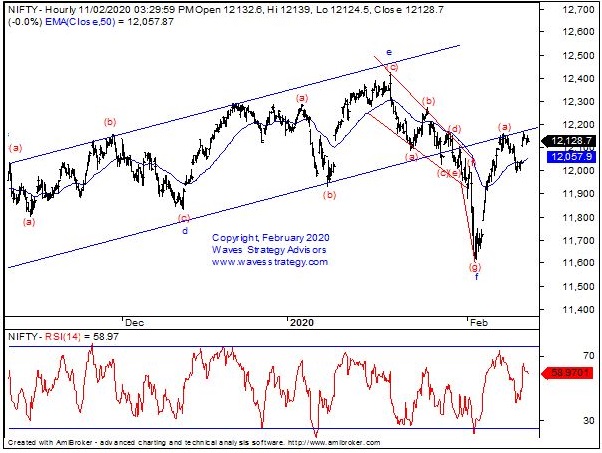
Now look at the below chart of Nifty that shows important pivot levels. A pivot level is essentially the area which results into reversal by either acting as a support or as a resistance
Nifty hourly chart:
(Below is the extract taken from the daily equity research report published on 11th February 2020)
Elliott wave analysis
We can clearly see that the majority of move on Nifty has been happening in just 2 to 3 hours and it moves in non-trending fashion on most of the days. This time as well there was a sharp up move on 4th February which lasted for around 3 hours and post that we are seeing non trending moves over past few days. The fall witnessed on 10th February was completely retraced back with a Gap up opening but only to see it moving sideways yesterday. It is therefore important to trade with smaller positions unless momentum picks up in either direction.
In short, Nifty is at crucial juncture. Break above …… will be short term positive for a trend towards ……… but the momentum might slow down from here on. Any break back below ………. will indicate a negative reversal.
Below are the trading strategy given over past few days and it has worked out brilliantly well on Nifty:
Trading Strategy given on 04th February morning- For today, long positions can be created if Nifty move towards 11950 and then bounces back above 12000 with day’s low as stop and target of 12050 levels. BANG ON!
Happened- Nifty moved precisely as expected showed a dip towards 11953 and then bounced back sharply.
Trading Strategy given on 05th February Morning- For today, long positions can be created above 12120 with 12060 as stop and target of 12160 levels. BANG ON
Happened- Nifty moved precisely as expected and made high exactly of 12160.60 levels.
The above clearly shows how one can capitalize on Elliott wave theory to form the trading strategy which we mentioned in our “The Financial waves trading update”
Daily Nifty trading research report gives the trading strategy for the day and equity research report gives outlook on stocks as well. Get access to “The Financial Waves short term update” Also know the medium term outlook on market by getting access to “The Financial Monthly update” Now is the time to act. Subscribe here