How to Derive Nifty Targets a Month in Advance!
Oct 18, 2021
Like this Article? Share it with your friends!
When a stock or index is trading near lifetime high levels very few techniques help to derive a target on the upside.
We had used a multitude of advanced techniques to derive the target of 18400 last month in “The Financial Waves Monthly Update” research report. Check out the research we had published on 10th September itself –
Figure1: Sensex Monthly chart (Log scale) (10th September 2021)
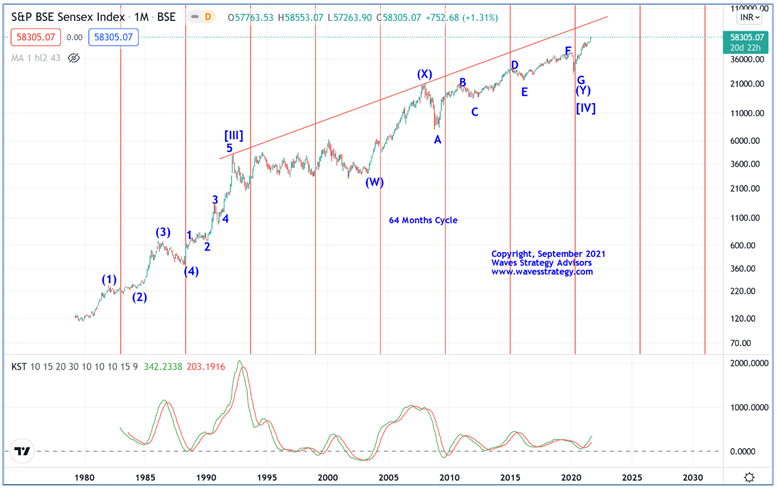
Figure2: Sensex Weekly chart (Log scale)
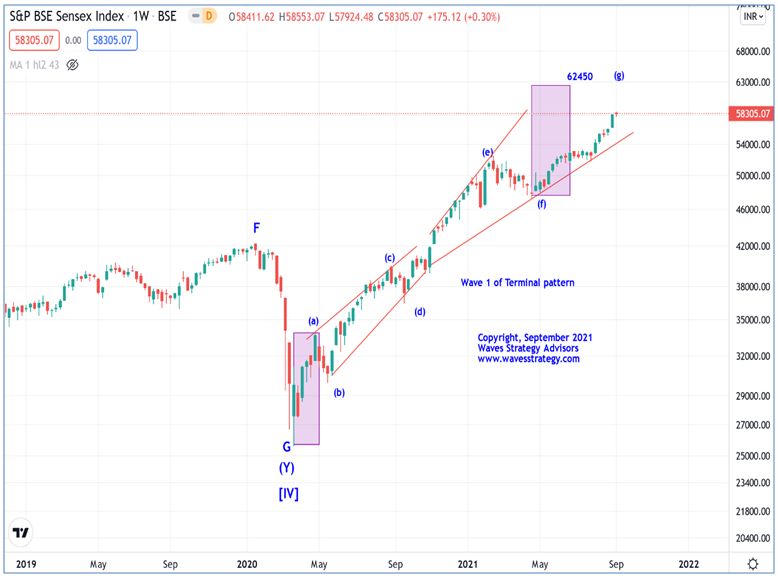
Figure3: Sensex Daily chart (Log scale)
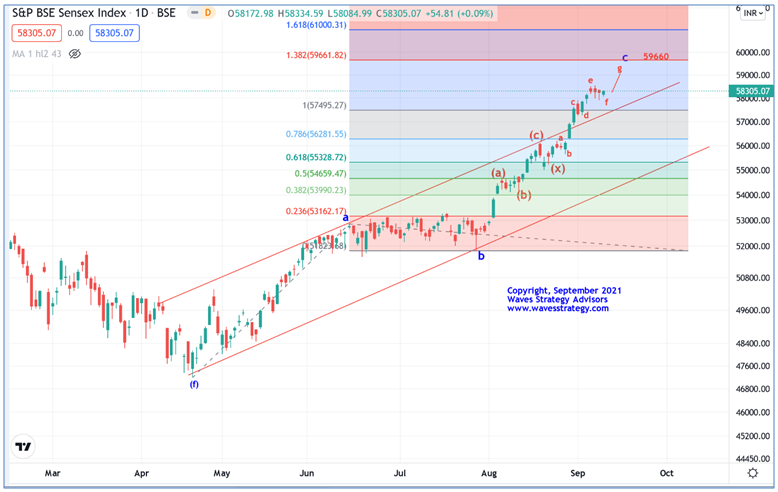
Figure4: Nifty Monthly chart
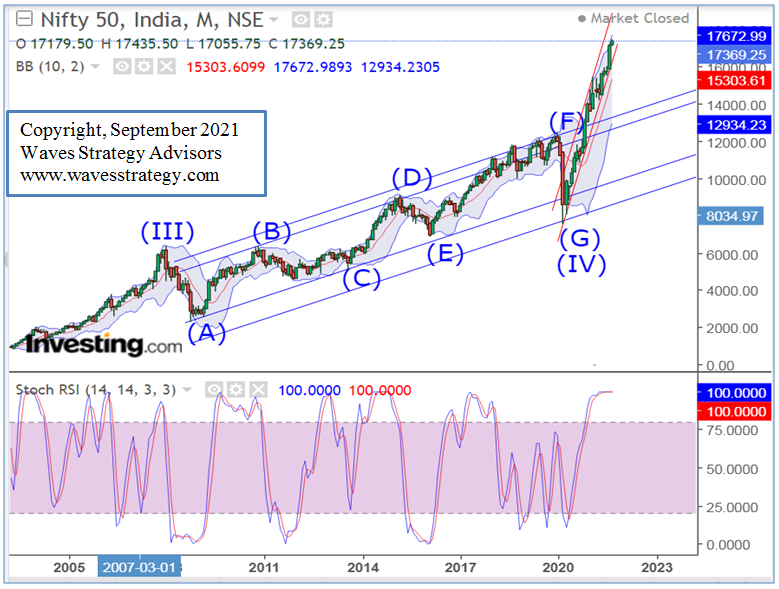
Figure 5: Nifty Weekly chart (Log scale)

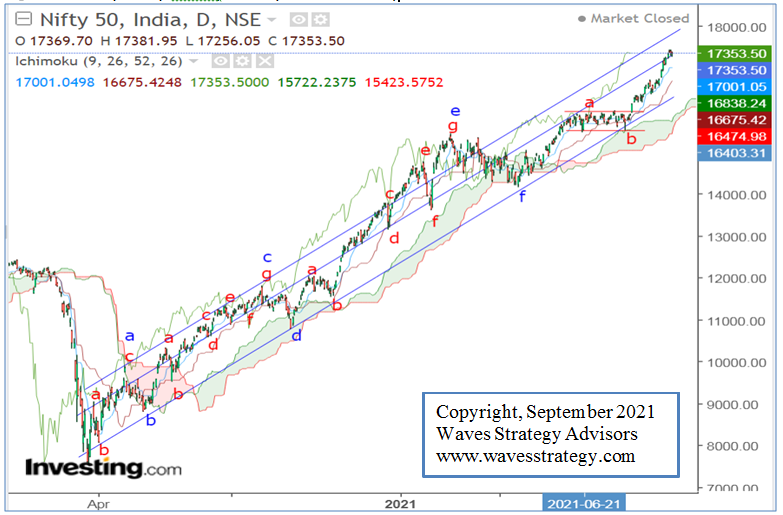
Figure 6: Nifty Daily chart(10th September 2021)
The month of August 2021 went spectacular for Indian Equity Markets in which Nifty rallied by 8.69% on a monthly closing basis from July to August. The lows of August was at 15834 level and high was at 17153 level which means it covered about 1319 points in a single month. Post that in the first week of September 2021, it has continued to rally and has tested the highs of 17435 levels till now.
This time we are showing Sensex chart from Monthly to daily time frames with Neo wave perspectives to understand the overall structure. Figure 1 shows that in the year of 1992 prices completed Primary wave [3] where we saw exponential gains and post that Primary wave [4] was ongoing in form of Complex correction pattern which completed at the lows of March 2020. This low is also coincided with 64 months’ time cycle which has formed crucial lows in the past. Within this pattern, since 2007, we witnessed Diametric pattern in form of intermediate wave (Y) and after that Primary wave (5) has started. The internal structure of this wave (5) is corrective in nature which suggest that it is forming Terminal Impulse pattern wherein intermediate wave (1) is running its course.
In the Monthly research report of 2013, based on Elliott and Neo wave forecasting, we predicted the target of 61000 for Sensex to be achieved in 2019-2020. We are near to this target now in the year of 2021. This suggests that how long term forecasting can help us to stay invested.
Figure 2 shows the Sensex weekly chart in which we can see that since the lows of March 2020 it has been forming Diametric pattern wherein minor wave (f) completed at 47250 levels and since then minor wave (g) is running its course. As per equality this wave (g) target is now placed at 62450 levels. Thus one should remain invested as long as 51800 is intact on downside.
Now let’s go one more step deeper. Figure 3 shows that the minute wave c (blue colour) is ongoing which is forming Double correction pattern. Second standard correction is forming Diametric pattern within which one more leg on upside is pending in form of wave g towards 59660 levels.
Let’s also look into the Nifty’s structure to understand the overall pattern.
Neo wave perspective: Before coming to the recent rise, let’s look at the overall structure since 2008. Here in the Figure 4 of Nifty monthly chart we can see that in the last quarter of 2007 prices formed crucial top and since then Diametric pattern is unfolding on upside. The reason being Diametric is entire rally is corrective in nature. Within this pattern, intermediate wave (F) completed in the first quarter of 2020 and post that severe fall was seen in from of minor wave a of intermediate wave (G). Here we are expecting that wave (G) is forming Running Flat correction pattern where in minor wave b is more than 1.618 times of wave a. The drawback of this wave b is as long as crucial support levels are protected on downside, such rise can continue. Thus as per this pattern, one leg on downside is pending in form of minor wave c which will complete the pattern in wave (G) and then next bigger rally should start which will be impulsive in nature. Nevertheless, as of now it is better to stay as long as we do not see any reversal signs.
Channelling technique: Here we can see that in the mid of 2020 prices broke above the channel resistance zone near 13000 level and since then strong uptrend has continued. After such break above the big channel, one can expect prices to fetch target as per the width of the channel. In the current case, width was 12430-7510 which comes to 4920 levels. Now this width target we can add further to the breakout near 13000 level which comes to 17920 levels. So far Nifty has made a high of 17435 levels. Thus there is further room to cover on upside.
Bollinger Bands: In the month of October-November 2020, prices sustained above the middle Bollinger bands for the first time after witnessing the sharp crash of Covid-19. Post that we can see that, middle bands have remain protected and prices have continued to rally. Medium term investors can use middle bands as trailing stop loss for investments in Nifty stocks which is now placed at 15295 levels. At the same time, it is intact into small upward rising red channel which is connecting lows since 2020. As per this channel, prices have more space to cover on upside.
Stochastic RSI Oscillator: This indicator we use to detect the momentum. Here we can see that from last few months, this indicator has continued to sustain near the territory of 100 levels and it has been managing to hold above red line. So as per this indicator, as long as it does not move below 75 levels, trend can remain positive whereas any move below the same will indicate that upside momentum has started to reduce.
Diametric pattern – Wave g extension: Now let us look at Figure 5 of the Nifty weekly chart which shows that in the month of March 2020 prices formed crucial lows near 7511 levels and since then corrective rally has been ongoing in form of a Diametric pattern. Here, minute wave f of pattern completed near 14151 level in the month of April 2021, and since then minute wave g is ongoing which is more than 100% of wave a. Since it has crossed above equality with wave a with strong momentum, we can expect it to move higher towards 1.618 times of wave a which is now placed at 18405 levels. This possibility will remain open as long as 10 weeks of EMA is intact on downside which is now placed at 16518 level.
Weekly bar technique: Since the breakout from 15950-16000 level, it was the 5th consecutive week wherein it continued the upside momentum protecting the lows of prior week. This remains one of the foremost technique to ride the trend as long as it goes. So as per this, 16764 is the immediate support level.
Figure 6 shows the Nifty daily chart with internal wave structure. Here from the lows of 14151, wave g is running its course which is subdividing further. From the lows of 14151, wave c (red colour) is ongoing which has already met equality with wave a. There is possibility that wave g itself might form Diametric or Extracting Triangle pattern. This we will decide based on the price action from hereon. For now it has been sustaining above all the indicators of Ichimoku Clouds and has taken out middle channel resistance decisively. The major drawback of this channelling technique is that as more time passes, resistance will tilt towards higher levels.
In short, Nifty has continued to move higher and trading into unchartered territory. During such kind of trends, it is better to follow the trend with trailing stop method to capture most part of the trend. Any close above 17500 level can result into continuation of up move towards 18000 level where next parallel channel resistance is placed on daily chart. In case of wave g extension target is open till 18400 level where 1.618 times of wave a is placed. On downside, 16700 can act as a major support level from hereon. In case of break below 16700 level, it will indicate that wave d of Diametric or Extracting Triangle pattern has started.
Happened:
Nifty weekly chart as of (18th October 2021)
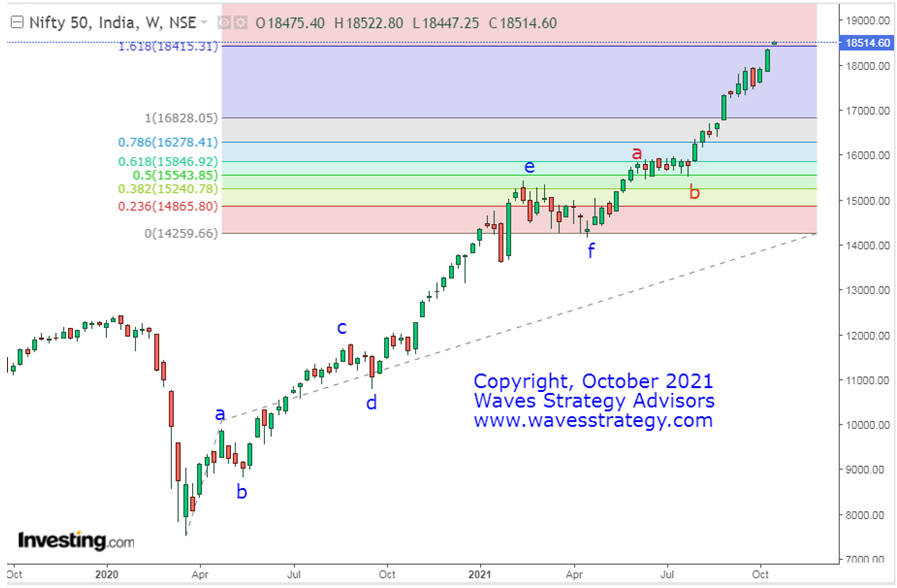
As we predicted a month ago, Nifty has now crossed above 18400 levels and has made a life time high of 18524 levels today.
To know the in-depth analysis from Elliott wave perspective, get access to the “The Financial Monthly Update”. You can also find detailed analysis on Outperforming sectors and Global market views Subscribe here
3 Months Mentorship on Timing the Markets - Learn to time the market and trade with me for the period of 3 Months including Live trading, stock selection, Momentum, and Multibagger stock identification, Timing the entry to the very Day, Hour, and Minute using Time cycles and Elliott Wave analysis. Early Bird ends on 25th October 2021. Get access to MOC as soon as you register for Mentorship, Contact +919920422202 for more details