NIFTY 55-Day Time Cycle: How to Time Market Swings
Feb 09, 2026
Time cycle analysis proves that it is possible to time the market. Most traders grow up hearing the opposite — “Never try to time the market.”
But the study of cycles shows that markets move in rhythmic patterns, and when these patterns are measured scientifically, they offer powerful forecasting capabilities.
We have posted a path ahead for Nifty using Neo wave and Time cycle in a short video published in our social media platforms like Twitter(x) on 3rd February 2026.
Nifty Daily Chart Anticipated as on 3rd February 2026.
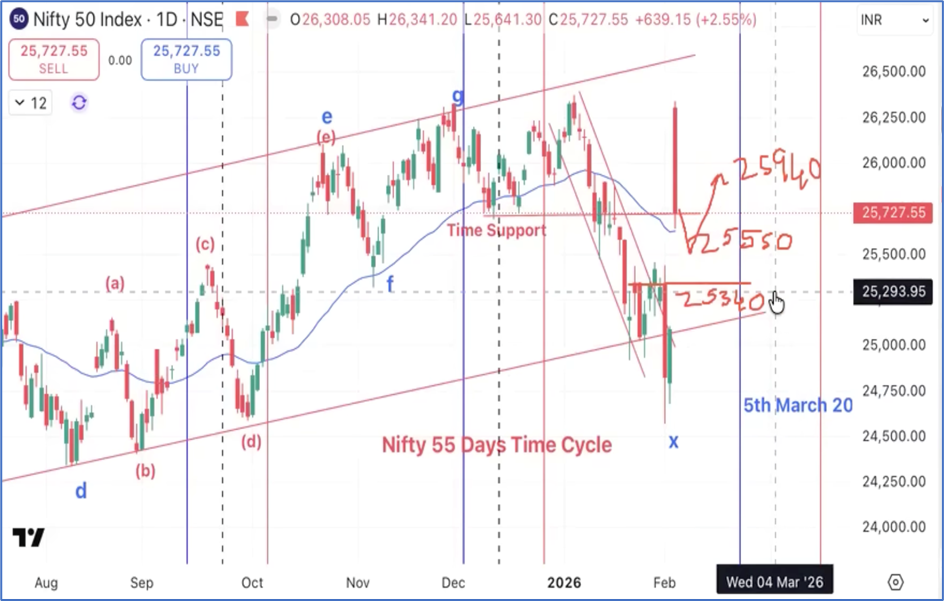
Anticipated as on 03rd February 2026
We had anticipated that a move towards the 25,550 Time Support would offer a buying opportunity in Nifty and if the Nifty Index holds above the support, upside move can be expected, with target of 25,940. On the downside, 25,340 stands out as the immediate and crucial support that must be defended to keep the bullish structure intact Bang on!
Nifty Daily Chart Happened as on 9th February 2026
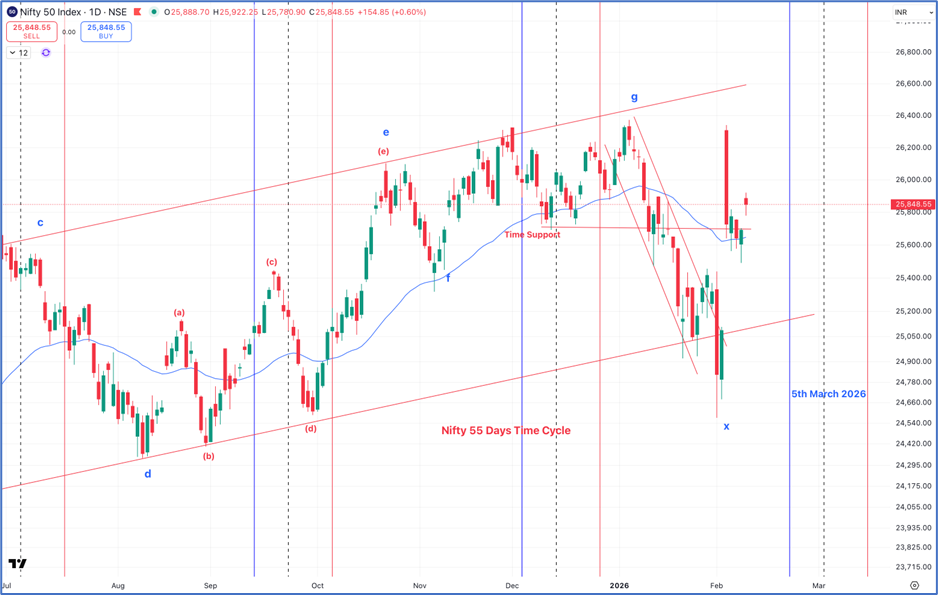
Happened as on 9th February 2026
The Nifty index has been moving precisely in line with our expectations. The index consolidated near the Time Support zone of 25,550 and formed a low at 25,491, following which we witnessed a healthy retracement. Prices rebounded sharply from this zone, confirming strong buying interest at lower levels. In today’s session, Nifty registered a high of 25,922.25, which is very close to our projected upside target of 25,940, validating the accuracy of the outlook.
In a nutshell, the trend for the Nifty index remains positive as per the 3-candlestick rule. Traders may continue to adopt a buy-on-dips strategy to ride the ongoing uptrend, as long as the index does not register a close below the prior day’s low.
3 months of Mentorship (Brahmastra) on Timing the Market – Apply Time cycles with Elliott wave, Neo wave, stock selection, risk management strategy, exclusive mentorship sessions & trade like a pro. Limited seat, Fill below form for more details