Nifty Time Cycle at Crucial Support as Small-Cap Index Tests Relative Strength Zone
Jan 12, 2026
Market Overview: Volatility Fueled by Global Policy Uncertainty
The NIFTY Index has been witnessing sharp intraday swings over the last few sessions as global markets react to trade deal uncertainty and policy-related headlines. Volatility intensified after developments around a proposed 500% tariff approved by Donald Trump, which if cleared by the US Congress could have implications for emerging markets such as India, China, and Brazil.
This led to accelerated downside pressure across Indian indices. However, sentiment improved after reports of renewed negotiations expected around January 13, triggering a strong rebound on January 12. NIFTY recovered more than 300 points from the lows, while Bank Nifty outperformed with a rebound of nearly 700 points, highlighting reactive buying at lower levels.
However, sentiment shifted again following fresh updates indicating the possibility of renewed negotiations on January 13, which led to a sharp recovery on January 12. NIFTY rebounded more than 300 points from
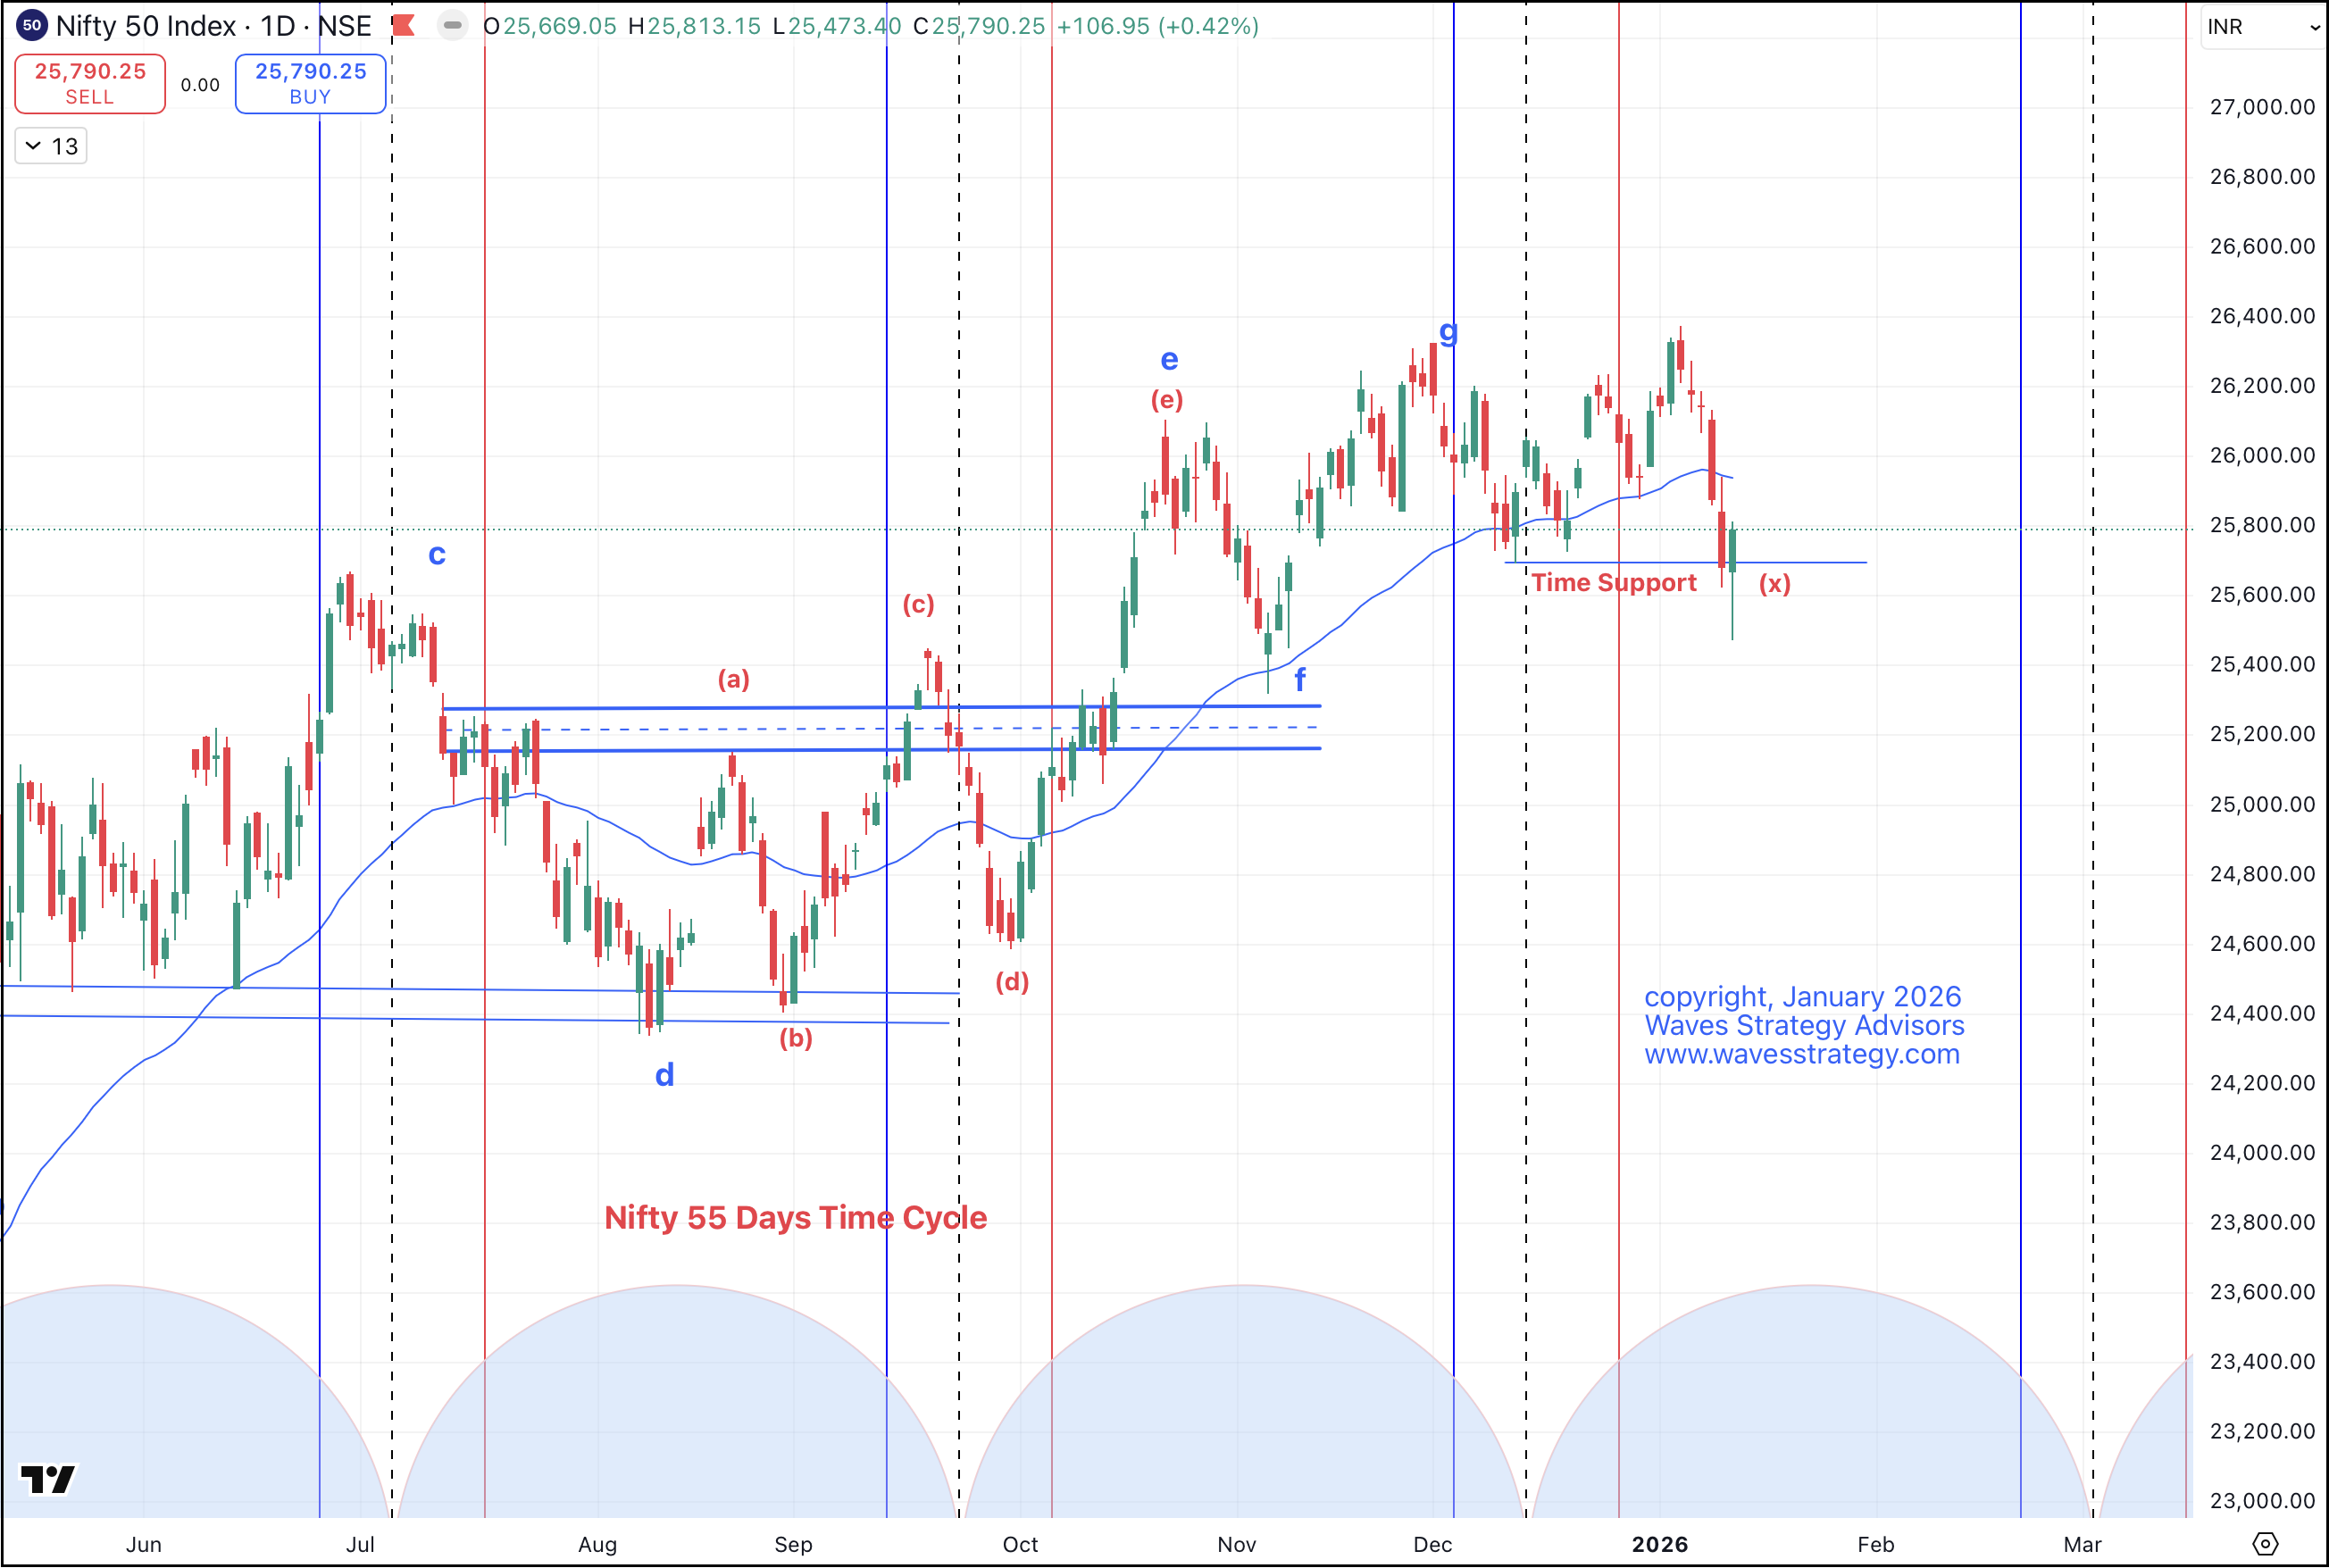
NIFTY Daily Chart: 55-Day Time Cycle Support Under Test
From a time cycle analysis perspective, NIFTY is currently trading around a crucial 55-day time cycle support zone, making this phase technically significant.
-
Prices briefly slipped below the 55-day time cycle support but quickly reclaimed it, indicating short-term demand.
-
Despite the bounce, the three-candlestick rule has not yet confirmed strength, as NIFTY has failed to close above the prior day’s high.
-
This keeps the near-term bias cautiously on the sell side, pending confirmation.
Key Price & Volume Levels to Watch
-
VPOC Resistance: 25,850
A daily close above 25,850 is essential to shift the bias back to the buy side. -
Critical Support: 25,473 (January 12 low)
A decisive break below this level could lead to fresh downside acceleration.
NIFTY is currently at a time–price convergence zone, and the next two trading sessions are likely to be decisive for trend direction.
NIFTY Daily Chart: 55-Day Time Cycle Support Under Test
From a wave-structure and Neo Wave perspective:
-
A breakdown below 25,473 would confirm continuation of the corrective phase.
-
A daily close above 25,850 would suggest downside exhaustion, indicating Wave X completion and a possible resumption of the uptrend.
-
Until one of these scenarios plays out, a wait-and-watch approach remains prudent.
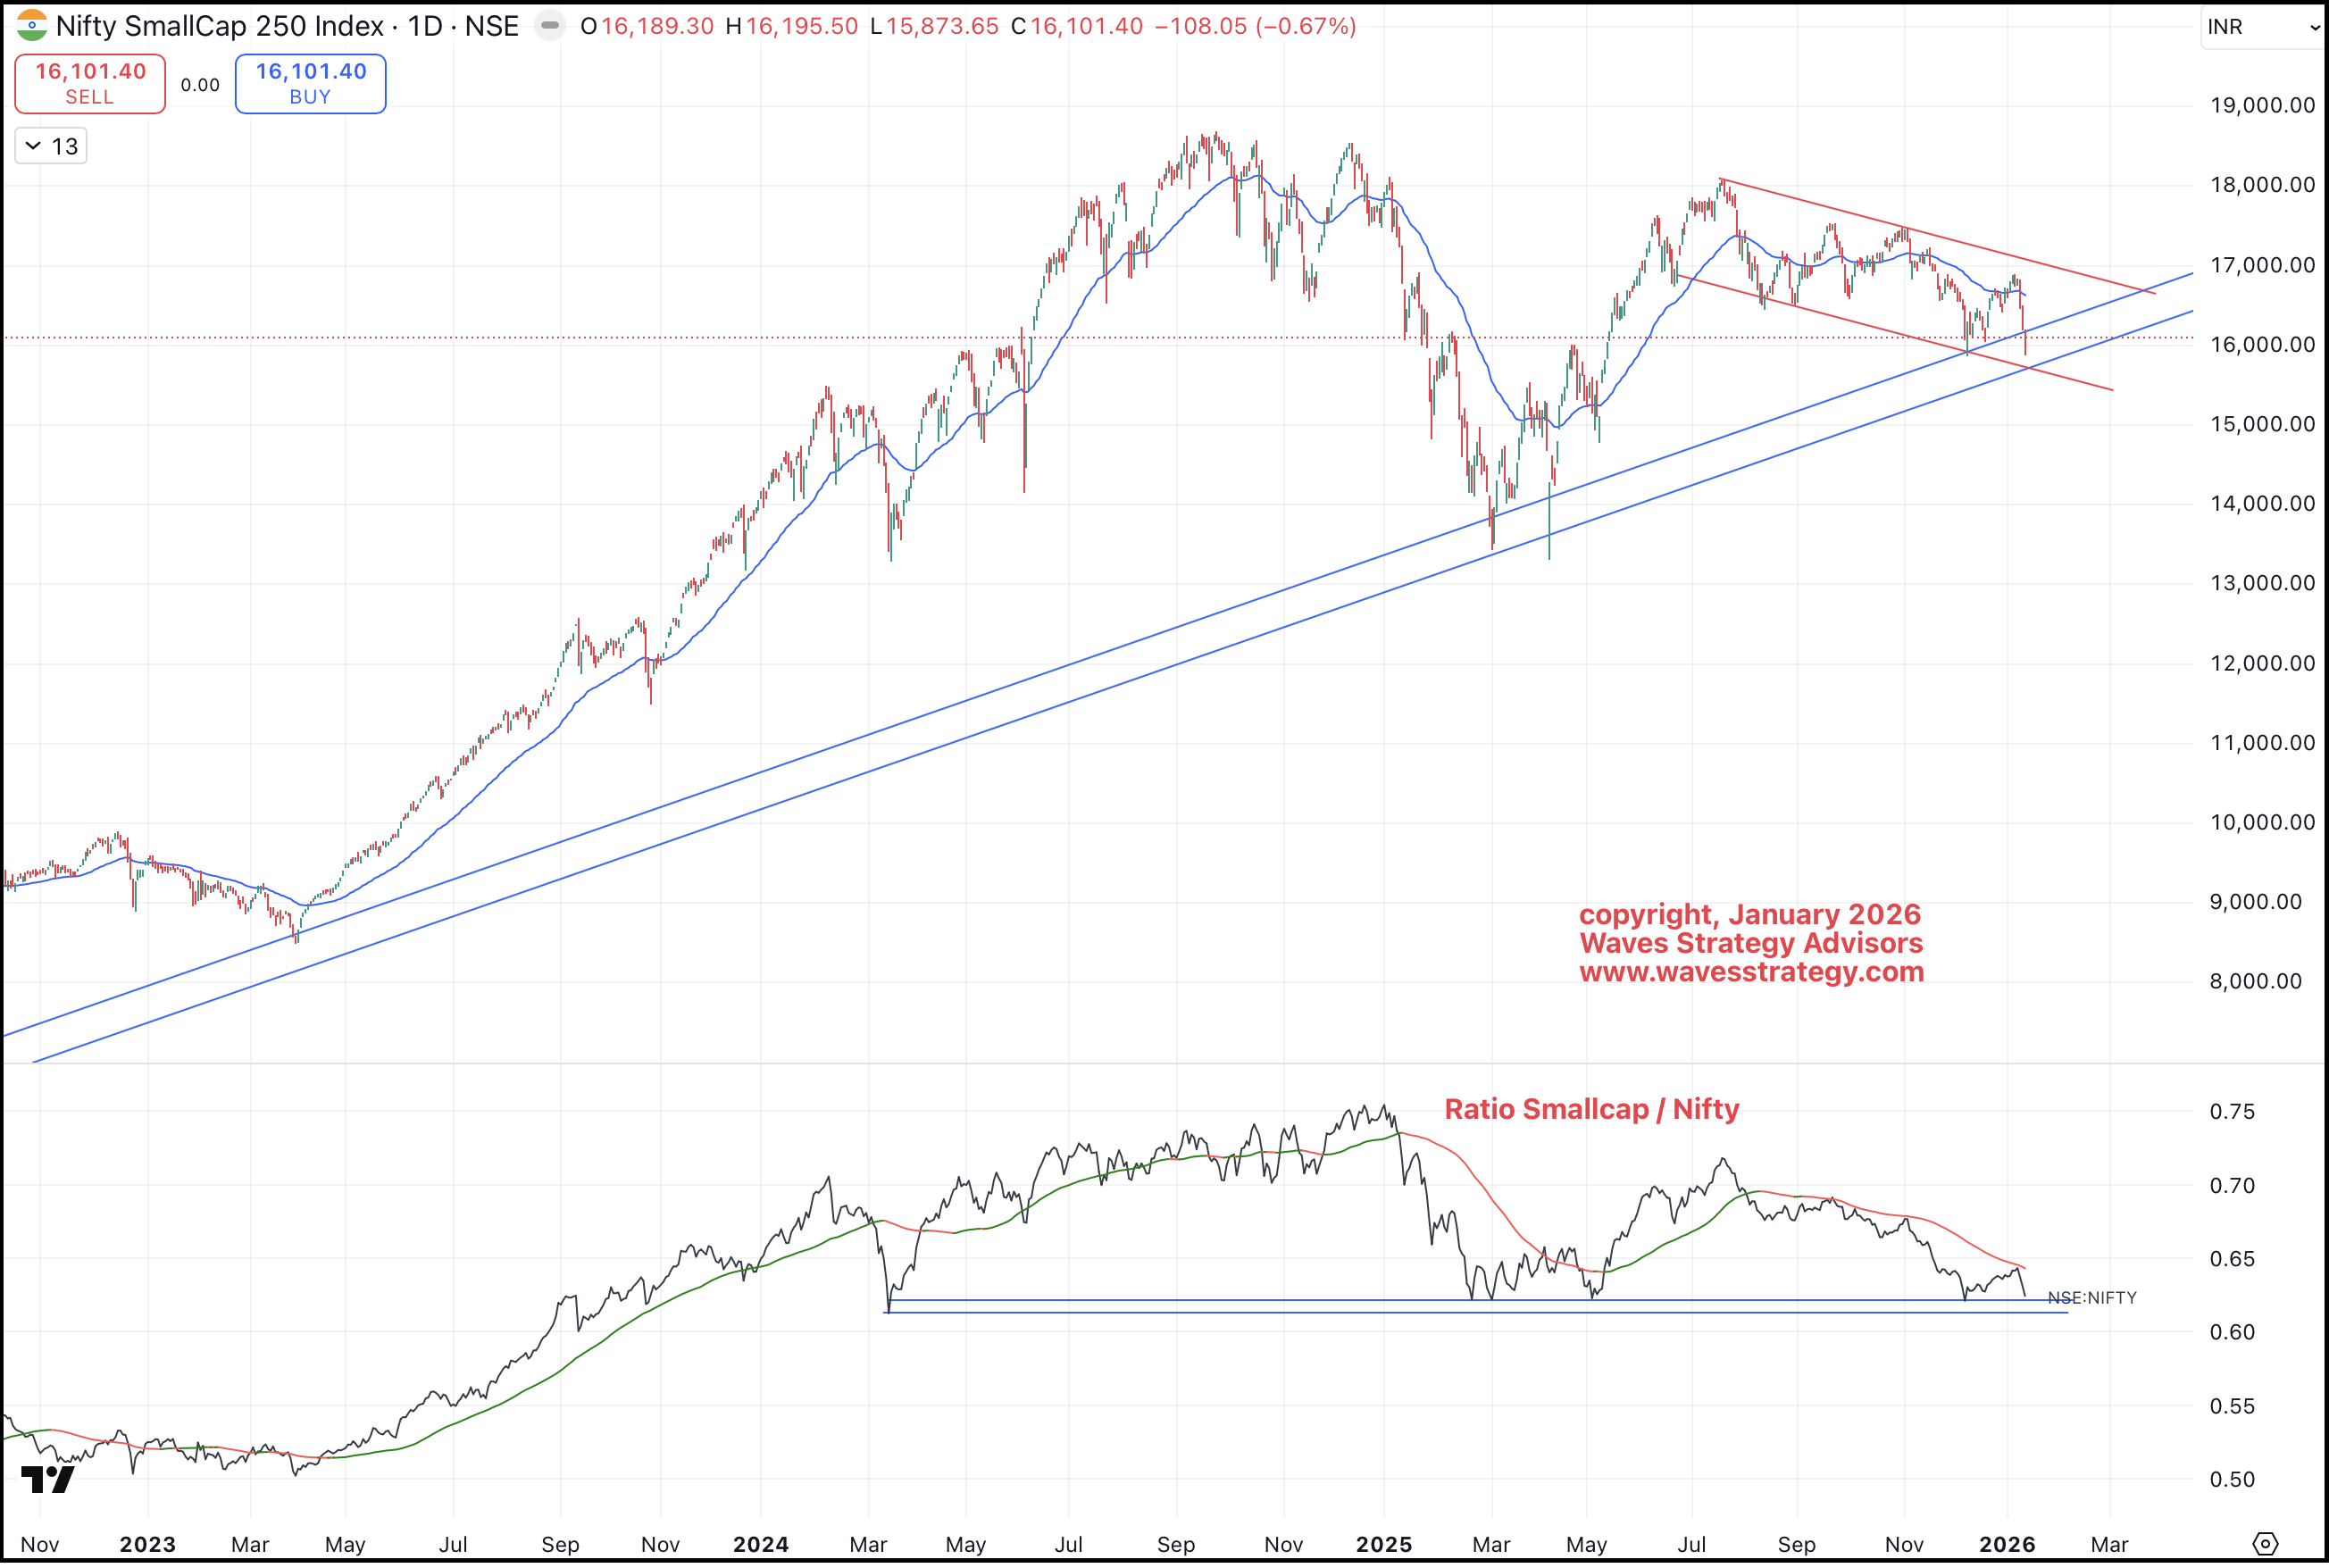
NIFTY Smallcap Index: Relative Strength at Structural Support
The NIFTY Smallcap Index to NIFTY ratio is also approaching an important inflection point.
-
The relative strength ratio has returned to a long-term support zone intact since 2024.
-
Historically, this level has been defended multiple times, highlighting its structural importance.
Smallcap Price Action Insights
-
On the daily chart, the Smallcap Index is testing the lower boundary of a rising channel.
-
This zone has triggered rebounds on three earlier occasions.
-
The recent close near 16,100 formed a long lower wick, indicating buying interest at lower levels.
-
However, confirmation is still pending.
Key Level for Smallcap Leadership
-
Bullish confirmation: Daily close above 16,400
-
Only a sustained move above this level would signal smallcaps regaining leadership versus NIFTY.
Key Volume and Price Levels
- The Volume Point of Control (VPOC) lies at 25,850, making it a critical resistance zone.
- A daily close above 25,850 is required to turn the bias back to the buy side.
- The low formed on January 12 near 25,473 is a very important support.
- Any decisive breach below 25,473 can result in sharp downside acceleration.
At present, NIFTY stands at a crucial time and price junction, and the next two trading sessions will be decisive.
Wave Structure Outlook: Conditional Bottom Formation
From a wave-structure perspective:
- A breakdown below support would confirm continuation of the downside
- A daily close above 25,850 would indicate downside arresting behaviour, suggesting that Wave X may be complete and that the up-move could resume
Until either scenario is confirmed, the prudent approach remains to stay on the sidelines and allow price action and events to provide clarity.
NIFTY Small-Cap Index: Relative Strength Ratio at Critical Support
The NIFTY Small-Cap Index relative strength ratio (Small-Cap / NIFTY) reveals an equally important development.
- This relative strength ratio has moved back toward a crucial support zone that has remained intact since 2024
- Historically, this zone has been defended multiple times, making it a structurally important level
Price Action on Small-Cap Index
- On the daily chart, prices have reached the lower boundary of a rising channel
- This zone has produced bounce-backs on three prior occasions
- The index closed around 16,100, forming a long lower wick, which indicates buying interest emerging at lower levels
However, confirmation is still pending.
Key Levels for Small-Cap Leadership to Resume
- A breakout and daily close above 16,400 is required
- Such a move would signal small-cap index taking leadership
- Without this breakout, the current move remains only a potential reversal, not a confirmed one
Conclusion: NIFTY at a Critical Time-Cycle Junction
In summary, NIFTY time cycle analysis suggests the market is at a pivotal decision point:
-
Both NIFTY and NIFTY Smallcap Index are testing crucial time-cycle and price-action supports.
-
The next two trading sessions are likely to define the short- to medium-term trend.
Bullish Confirmation Requires:
-
NIFTY daily close above 25,850
-
Smallcap Index daily close above 16,400
Failure to hold current supports could reopen the door for renewed downside volatility. Until confirmation emerges, discipline, patience, and close observation of price action remain essential.
Brahmastra (Mentorship) – Learn the science of trading with complete handholding and live trading sessions, along with stock selection algos and options trading combined with Neo wave strategy. Fill form below for more details