
Can Nifty’s Time Cycles Predict Major Market Turning Points?
Nov 09, 2026
When Neo Wave analysis is combined with simple price action and Time Cycle, it significantly improves the accuracy of forecasts and helps traders identify high-probability trading opportunities.
As highlighted earlier, in our previous monthly report on Nifty dated 30th October 2026 we had alerted our clients that the Index has entered our 55 day time cycle zone.
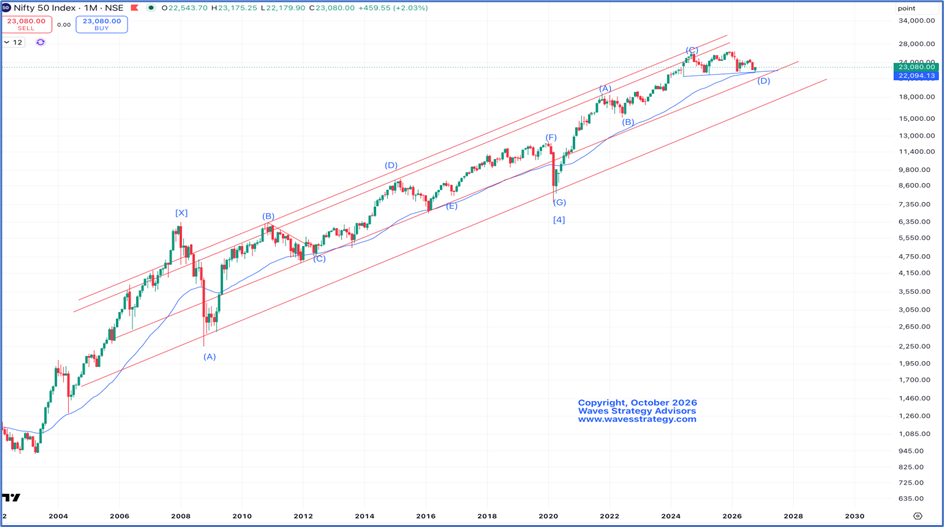
Nifty Monthly chart: Anticipated as on 30th October 2026
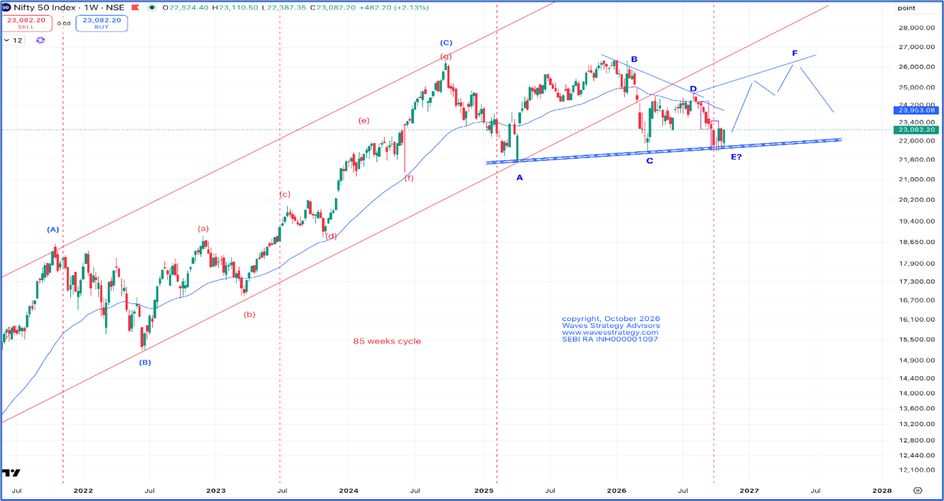
Nifty Weekly chart: Anticipated as on 30th October 2026
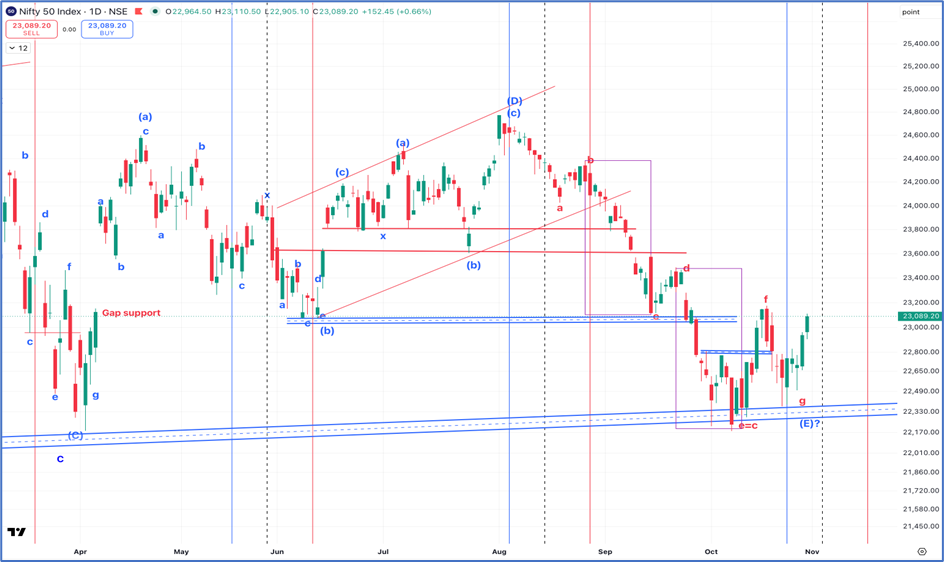
Nifty Daily chart: Anticipated as on 30th October 2026
Anticipated on 30th October 2026
The monthly chart shows that Nifty is positioned at a crucial long-term trendline support, formed by connecting the low of June 2024, the election-day low, the subsequent low in April 2025, and the low formed in April 2026. The current decline has once again approached this important trendline support, from where the index has started showing some positive traction. As highlighted in our previous monthly research, the end of September 2026 was an important time-reversal window as per the 85-week cycle, which we will discuss in detail in a subsequent section. Interestingly, the low recorded in the first week of October at 22,179 was just a few points below the April 2026 low of 22,182, making this an extremely important price zone to monitor.
This breach of the Wave C endpoint has an important implication from the perspective of Neo Wave theory. In a Triangle pattern, Wave E should not breach the endpoint of Wave C. Since the current price structure has violated this condition, the Triangle interpretation is no longer valid, and the pattern now appears to be developing as a Diametric, which consists of seven corrective legs.
Following the completion of Wave E, the next expected move is Wave F on the upside. Historical price action from 1997 onwards provides an interesting reference, where Wave F moved higher and surpassed the high of Wave D. Applying a similar structural interpretation to the current market, we expect Wave F to push Nifty higher, potentially taking the index above 25,000.
This upward movement could create considerable optimism and euphoria among market participants, with many potentially interpreting it as the beginning of a fresh bull market. However, our preferred interpretation is that this would still be part of the larger corrective structure rather than the beginning of a sustained major bull market.
The daily chart indicates that Nifty has now entered the week of 4 November 2026, marking an important 55-day time-cycle window. This creates a rare confluence of two significant time cycles: the 55-day cycle and the 85-week cycle. Historically, such combinations have often coincided with important market turning points and, on several occasions, have resulted in strong positive reversals.
From the ongoing Elliott Wave structure, there is a possibility that Wave g of the Diametric pattern has completed near 22,480, forming a truncated low. The subsequent recovery could therefore represent the beginning of a fresh upward movement in the form of Wave f. However, it is still too early to confirm this interpretation. A decisive move above 23,180 would provide the required confirmation, as it would indicate that the entire Wave g decline has been retraced in a relatively shorter time, bringing the price and time structures back into alignment.
If this scenario unfolds, the anticipated rally could surprise a majority of market participants who remain focused on global macroeconomic concerns, including higher crude oil prices, rising bond yields and a depreciating Indian Rupee. Markets do not always move in tandem with intermarket developments and can, at times, behave independently of global macroeconomic factors. Therefore, the current price action suggests that a potential Wave F advance may already be underway.
The immediate upside expectation is towards 24,200, followed by a possible extension beyond 25,000, as discussed in our previous research. Such a rally could initially catch many market participants by surprise, with several turning bullish only during the latter stages of the move and interpreting it as the beginning of a fresh bull market. However, as per our preferred Elliott Wave interpretation, this upward movement would still represent Wave F of the larger Diametric structure, which could eventually terminate before the final Wave G decline begins.
In a nutshell, we appear to have entered a very important time-cycle window, with the possibility of December witnessing the strongest momentum during the ongoing recovery. The year 2026 has been particularly challenging for Indian equities, both in terms of foreign institutional investor (FII) outflows and the relative underperformance of the Indian market. There is now a possibility that this prolonged phase of weakness is approaching its conclusion.
In a nutshell, the next rally in Nifty could take a majority of market participants by surprise. A decisive move above 23,180 would provide strong confirmation that Wave E has completed and Wave F has started, opening the possibility of an upward move beyond 24,000, followed by the larger upside targets of 25,200–25,300.
This rally could create the much-needed euphoria in the market, with many participants interpreting it as the beginning of a fresh bull market. However, as per our preferred wave structure, this optimism could eventually fade as Wave F approaches completion, followed by the final corrective Wave G on the downside.
We believe that Nifty IT could emerge as a key sectoral leader supporting this recovery, and the potential turnaround in IT stocks could surprise a large section of market participants.
We are closely monitoring the short-term charts and will communicate important developments through our Short-Term Research Reports as the anticipated price structure unfolds.
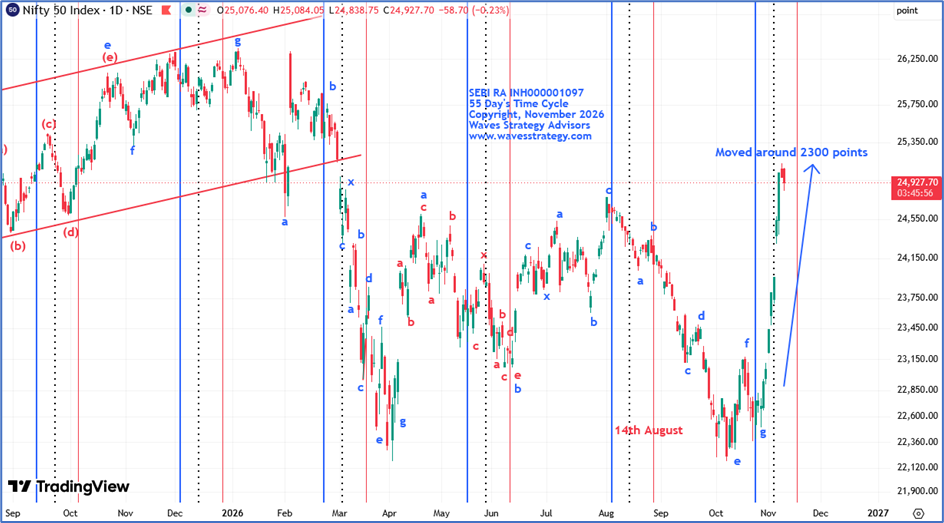
Nifty Daily Chart: Happened as on 09th November 2026
Analysis
- We have been mentioning about the 85 Weeks’ Time cycle in our prior monthly report and as expected, Nifty bounced back from the 85 Weeks’ Time cycle near 22200 level and has rallied more than 2800 points indicating the significance of the same.
- This low of near 22200 - 22400 was also aligned with the 55 period Daily Time cycle acting as a strong base for the Index going forward.
- Nifty has witnessed a strong upward rally, with the previously projected upside target of 25,200 – 25,300 The index has recorded a high of 25,131.85, and is currently approaching our anticipated target.
- This move reinforces the bullish outlook following the completion of Wave E and the start of Wave F on the upside.
Conclusion
- Neo wave when combined with simple price action and Time Cycle can provide powerful trend signal.
- In a nutshell, Time cycles can help a trader to predict accurate timings to initiate positions and manage them accordingly.
- For now, buy-on-dips approach is the prudent strategy to go for with an upside target placed near the 25400 level.
- On the downside 24880 remains the crucial support level that needs to be sustained to maintain the positive outlook.
Kaal Chakra
Master of cycles: Be a part of elite trading community who trades time by combining the concepts of Hurst’s Time cycles along with Gann square of 9. Live sessions on 28th – 29th November, Application of time trading, deriving targets using time, stoploss management with list of stocks along with time period. Act now, Limited seats only – Know More
3 months of Mentorship (Brahmastra) on Timing the Market
Apply Time cycles with Elliott wave, Neo wave, stock selection, risk management strategy, exclusive mentorship sessions & trade like a pro. Limited seats, Fill below form for more details.