The Nifty Trap Nobody Warned You About — And What Breaks It!
May 22, 2026
Neo Wave helps to understand the rhythm of the market by identifying probable future price action ahead of time. With disciplined execution, it becomes a powerful tool for tracking trends across equities, indices, and commodities.
The analysis below is from our monthly report published on 24th April 2026.
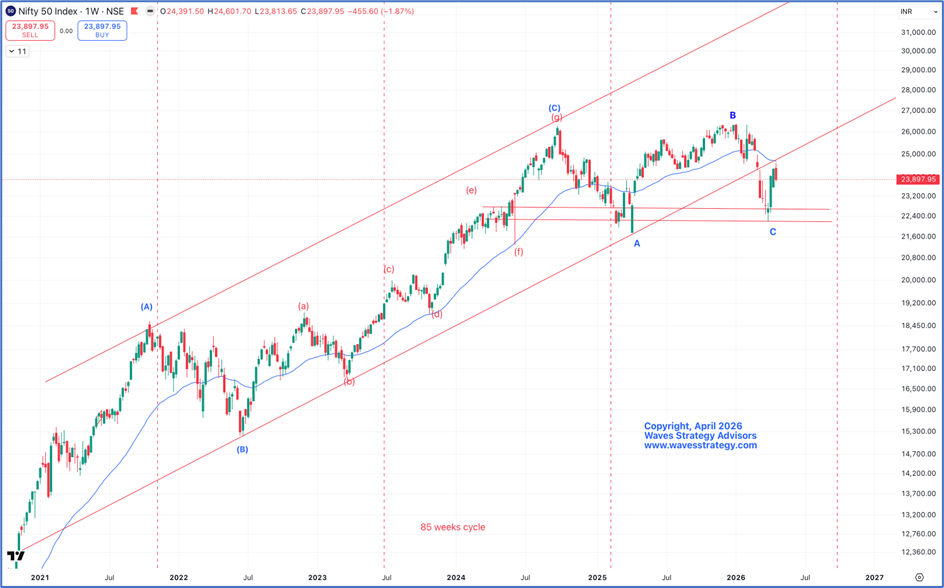
Nifty Weekly chart as on 24th April 2026
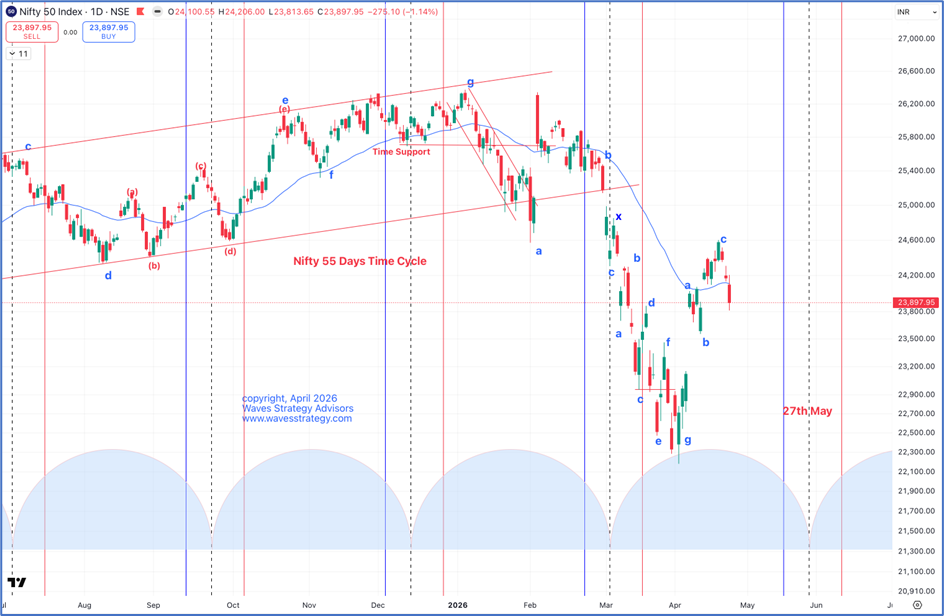
Nifty daily chart with Time cycle
Structurally, from the weekly chart, price action since 23rd September 2024 appears to be forming a triangle pattern, with wave D currently in progress. This wave may further subdivide into a diametric formation, which will be elaborated in the subsequent section.
On the daily timeframe, the structure indicates that prices have moved up and likely completed wave c near 24,600. From a level-based perspective, 23,555 becomes a critical support threshold — a breach below this level would increase the probability of an extracting triangle, which carries a bearish implication.
From a time-cycle standpoint, a stronger bullish momentum is expected post 27th May, when the 55-day time cycle becomes due. Until then, the market is likely to remain in a consolidation phase, potentially forming the triangle structure highlighted on the weekly timeframe.
At present, the market remains highly event-driven. Key triggers include the outcome of the geopolitical discussions between United States and Iran, along with the anticipated trade agreement between India and the United States, expected to progress by the end of the month. The outcomes of these developments could introduce sharp directional moves, while any delays or uncertainty may keep the market anxious and range-bound.
In summary, the overall undertone for Nifty remains sideways in the near term, with a major upside hurdle near 24,800 and a key downside gap support near 23,200. The coming weeks are likely to witness price oscillation within this broad range, creating a favorable environment for traders. For investors, this phase presents an opportunity to accumulate quality stocks in a staggered manner, while remaining cautious, as a break below 23,200 could turn the structure fragile again.
Nifty Daily chart as on 22nd May 2026
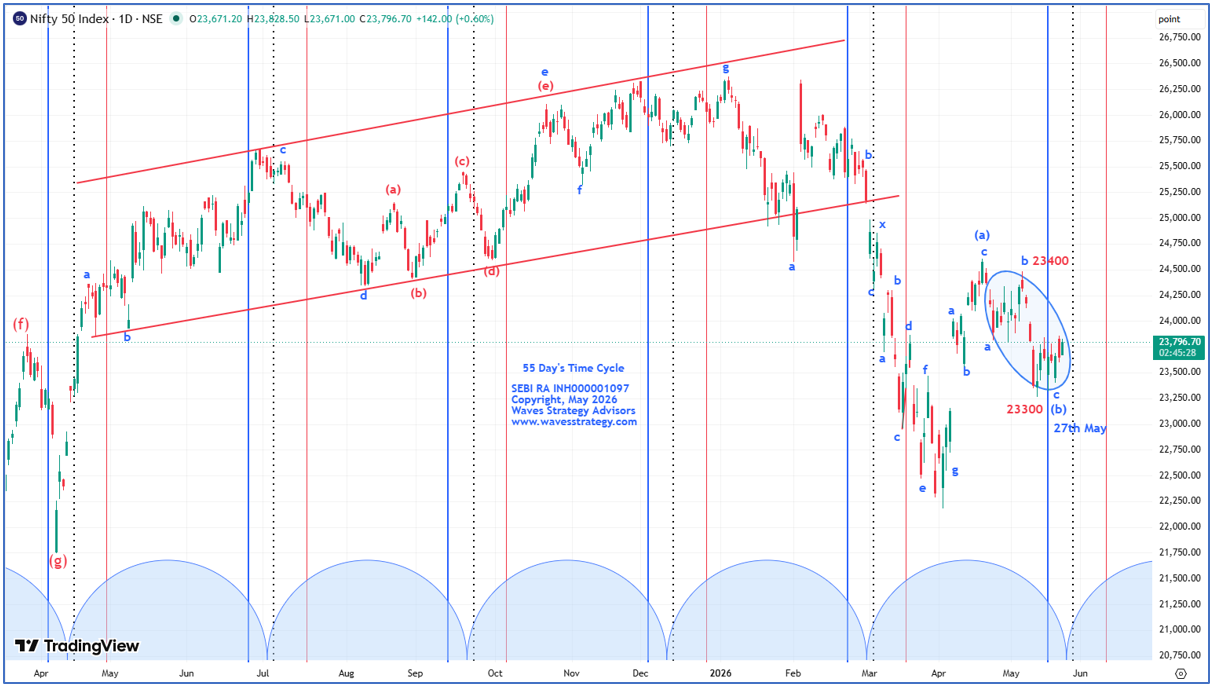
Happened as on 18th May 2026
Nifty moved precisely as expected. Prices failed to break above the 24800-zone taking resistance near the 24400 and fell almost 1200 points and found support near 23300 zone.
Currently, Nifty is oscillating within the 23,300–23,860 range, forming a fractal triangle structure on the charts. In addition, the index is trading within the 55-Day Time Cycle zone, which explains the ongoing range-bound action and frequent false breakouts on both sides which is typical characteristic feature of triangle formation.
Unless Nifty gives a decisive hourly close above 23,860 or breaks below 23,300, the ongoing consolidation phase is expected to continue.
In the current setup, traders are advised to avoid aggressive directional positions and instead focus on creating short strangle until a decisive breakout emerges on either side.
Brahmastra (Mentorship on Timing the market)
Learn to time the market and trade with me for the period of 3 Months including Live trading, stock selection, Momentum, and Multibagger stock identification, Timing the entry to the very Day, Hour, and Minute using Time cycles and Elliott Wave analysis. Get access to Kaal Chakra (Master of Cycles) as soon as you register for Mentorship, Fill below form for more details: