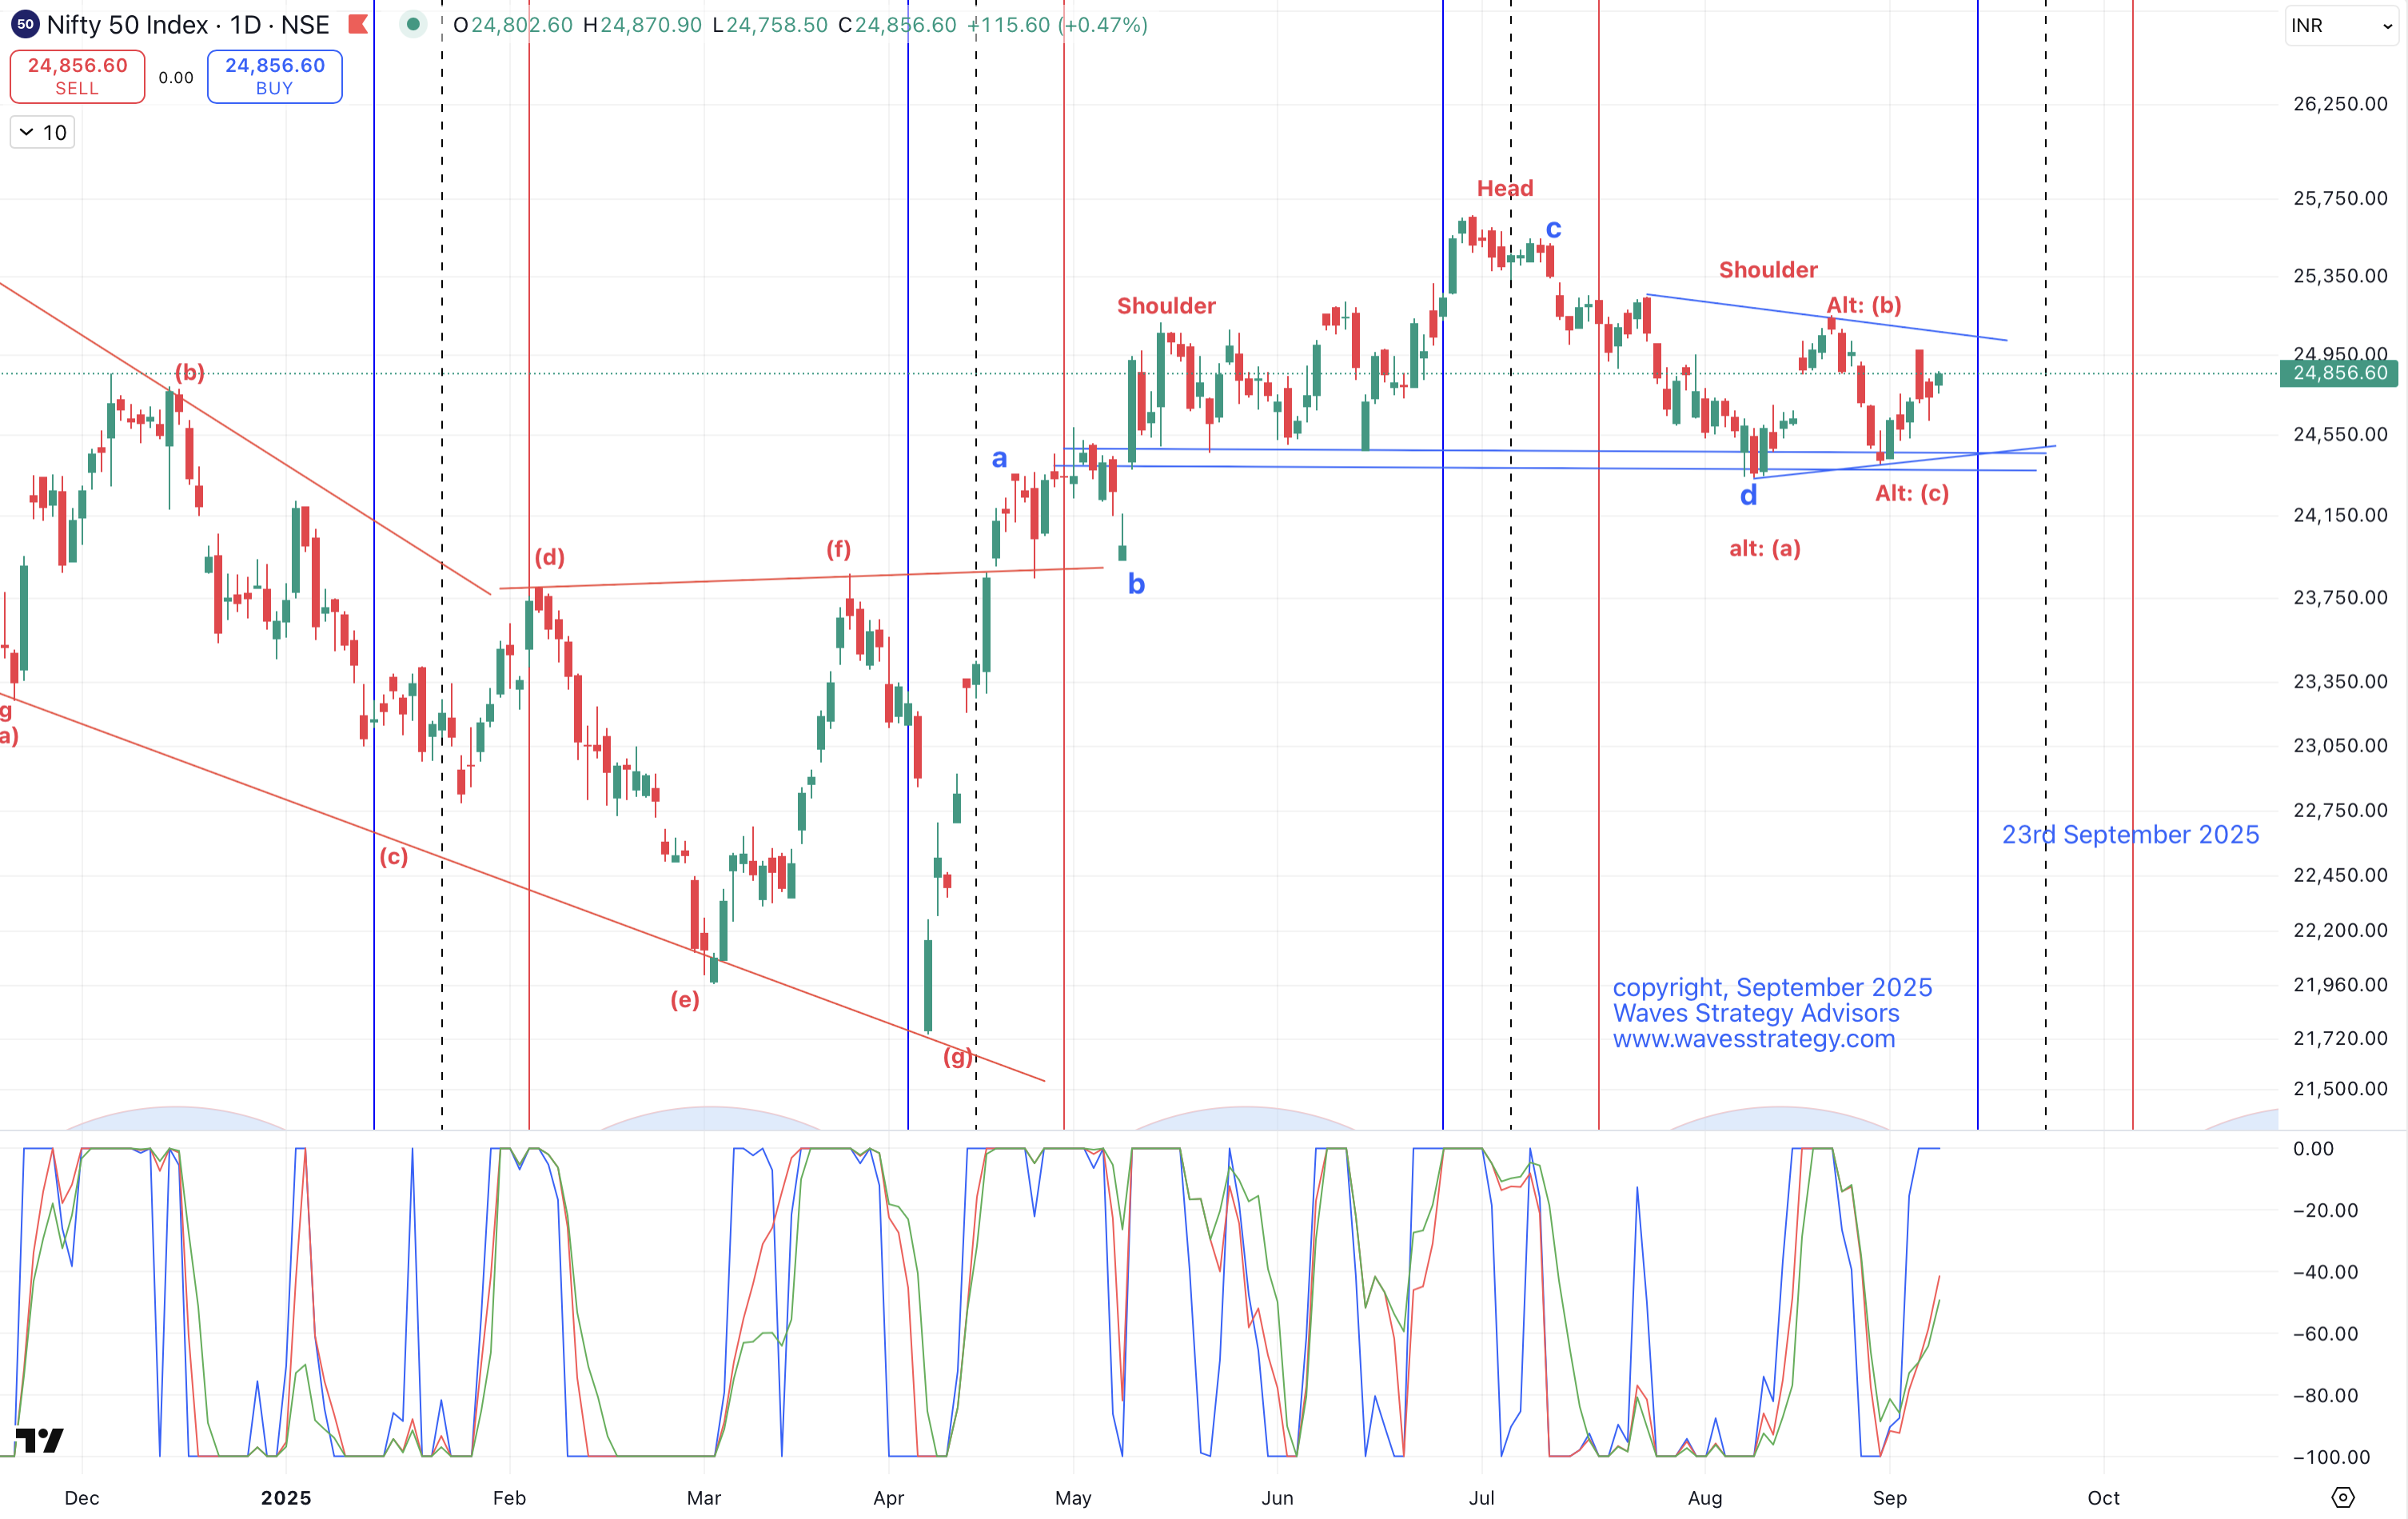
Nifty Diametric Neowave Pattern with 55 Days Time cycle
Sep 08, 2025
Nifty advanced Elliott wave – Neo wave pattern provide strong forecasting ability right from short to long term forecasting.
It is important to identify the pattern to trade profitably using good risk reward setup.
Nifty Neo wave daily chart Elliott wave analysis – Nifty has been moving in a range since 4 months with prices awaiting a strong trigger. As per time cycle 23rs September 2025 is when we should see meaningful low and upside momentum can pick up. Time is dynamic and so 5 days of leeway is possible and se we have shown the range.
As per above chart, prices look to be forming triangle pattern within wave (e). Post completion of this pattern we can see a strong trend move probably on downside but it is important to get price confirmation below 24620 levels.
Alternate possibility – A smart trader is always aware about the lower probable scenarios in case of adverse movement. As per this the entire wave d can form triangle pattern itself as shown by alternate counts. This is a strong bullish scenario and will be preferred on break above 25100 levels.
AK custom indicator – is shown below the chart which highlights non trending behaviour as all the 3 lines are separated. We have been talking about it since weeks that as per this indicator Nifty is in non trending range and scalping is the best strategy until all 3 lines connect back together again!
In a nutshell, we might still have a week of consolidation as per Time cycle and 24620 – 25100 is the range. Break of these levels will provide strong forecasting ability to capture the next trending move.
Brahmastra (Mentorship) on Timing the market – 3 months of Mentorship can transform you as a trader who is looking forward to learn the systematic science of trading using Time cycles, Elliott wave, Neo wave, stock selection algos, Risk management. Only a few seats left, Fill below form for more details:
