Nifty Moving in Wave d: More Pain Ahead or Sharp Reversal?
Apr 24, 2026
Neo Wave works like a GPS of the market — helping us understand not just where the price is today, but the probable future path based on objective pattern logic. By applying Neo Wave concepts, traders and investors are able to anticipate high-probability turning points, ongoing structure, and upcoming trend behaviour with a systematic approach rather than emotional reactions.
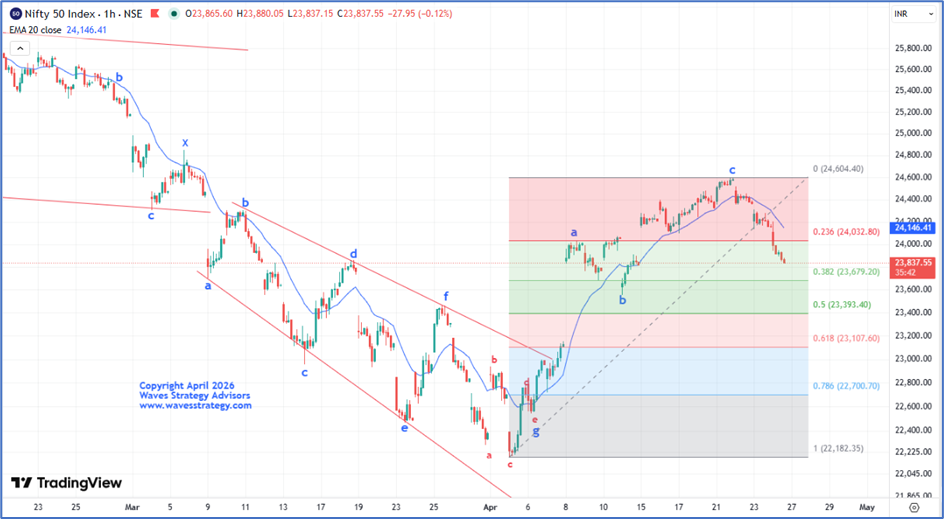
On the chart above, we are analysing the Nifty hourly timeframe using detailed Neo Wave counts. After completing the corrective decline as wave g, prices formed a low near 22,500 levels, marking the completion of the previous leg of the Diametric pattern.
Ongoing move Forming Diametric Pattern
- Since the low near 22,500, the index has been moving higher.
- The current up move is unfolding in the form of a Diametric pattern.
- Within this structure, wave c got completed near the 24,600 mark.
- We had earlier indicated a possible correction in the form of wave d in our short-term daily research report Agni and in our free webinars.
Today’s Market Action & Target Achieved
- Nifty opened with a minor gap down in today’s session.
- Selling pressure increased as the session progressed.
- Prices successfully achieved the downside target zone of 24,030–23,970 levels.
Key Levels to Watch Ahead
- The current decline is expected to continue in the form of wave d.
- This view remains valid as long as prices stay above the low of wave b near 23,550 levels.
- Any decisive break down below 23,550 can suggest that the recent rally was only a trap.
Global Factors Creating Pressure
- Rising uncertainty around United States-Iran peace negotiations is weighing on sentiment.
- Rising Crude oil prices are also adding pressure on markets.
- Any positive progress in negotiations can quickly improve sentiment.
Positional View Remains Risky
- Current market volatility remains elevated.
- Geopolitical uncertainty is still high.
- Carrying positional trades remains risky at present
Advanced Forecasting Approach
- By combining Elliott Wave Theory, Neowave advanced pattern rules, and multiple analytical techniques, markets can be forecasted with exceptional accuracy.
- This integrated approach helps traders identify the broader trend direction with clarity.
- It also allows precise projection of market turning points, including day, hour, and even minute-level moves.
Key Levels to Watch
- Key Support: A break below 23,550 levels can indicate that the recent up move was false.
- Key Resistance: For fresh buying momentum, Nifty needs to break above 24,030 levels. Until then avoid buy.
Brahmastra: Go Beyond Price – Learn Time Cycles
Brahmastra is a 3-month intensive journey focused on:
- Time Cycle Analysis
- Combining Time + Elliott Wave
- Precision in identifying turning points to the day
Includes
- Tradership sessions
- Full access to Trishul Program
- Structured trader development approach
This program is built on a powerful belief:
Markets can be timed—not just analyzed.
👉 For more details, click here
Trishul Program: Master the Three Pillars of Market Understanding
Trishul is designed as a structured learning pathway combining three powerful frameworks:
- Options Mantra (Online Videos)
- Elliott Wave (Foundation to Advanced)
- NeoWave (Advanced Forecasting tool & Precision)
What You Learn
- Event-driven options strategies
- Expiry-day income frameworks
- Risk-reward based trade construction
- Tools like Keltner Channels & KST
- Practical stop-loss & execution discipline
This is not theory—it is applied market understanding.
👉 Limited seats only. Fill the form below to apply.