Nifty - Is This Start of Crash! Down 300 Points, Get Ready
Nov 22, 2021
Like this Article? Share it with your friends!
Nifty has shown a crash of more than 300 points as on 22nd November 2021 and such big moves only indicate start of a bigger downtrend.
We have been cautioning our subscribers over past few days and they are not surprised by this ongoing crash.
We published Nifty analysis in "The Financial Waves Short Term Update" Check out below the detailed research report that we published.
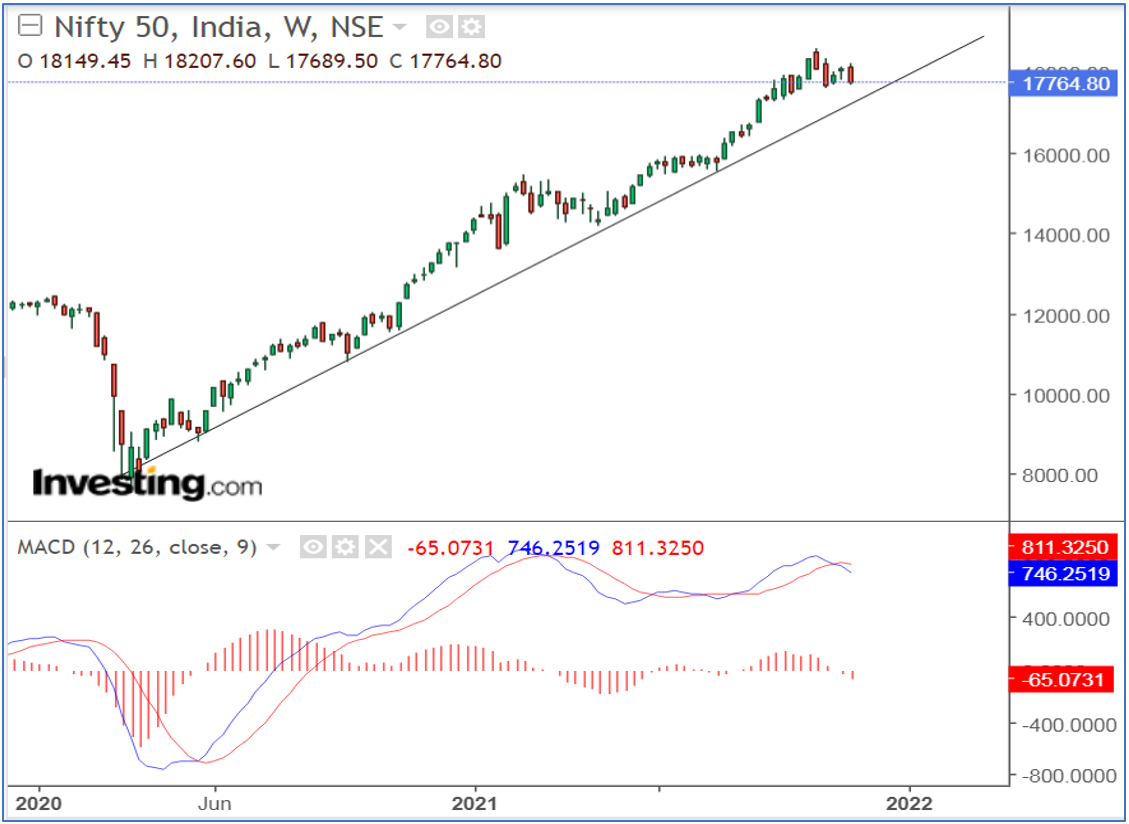
Nifty Weekly chart (18th November 2021):
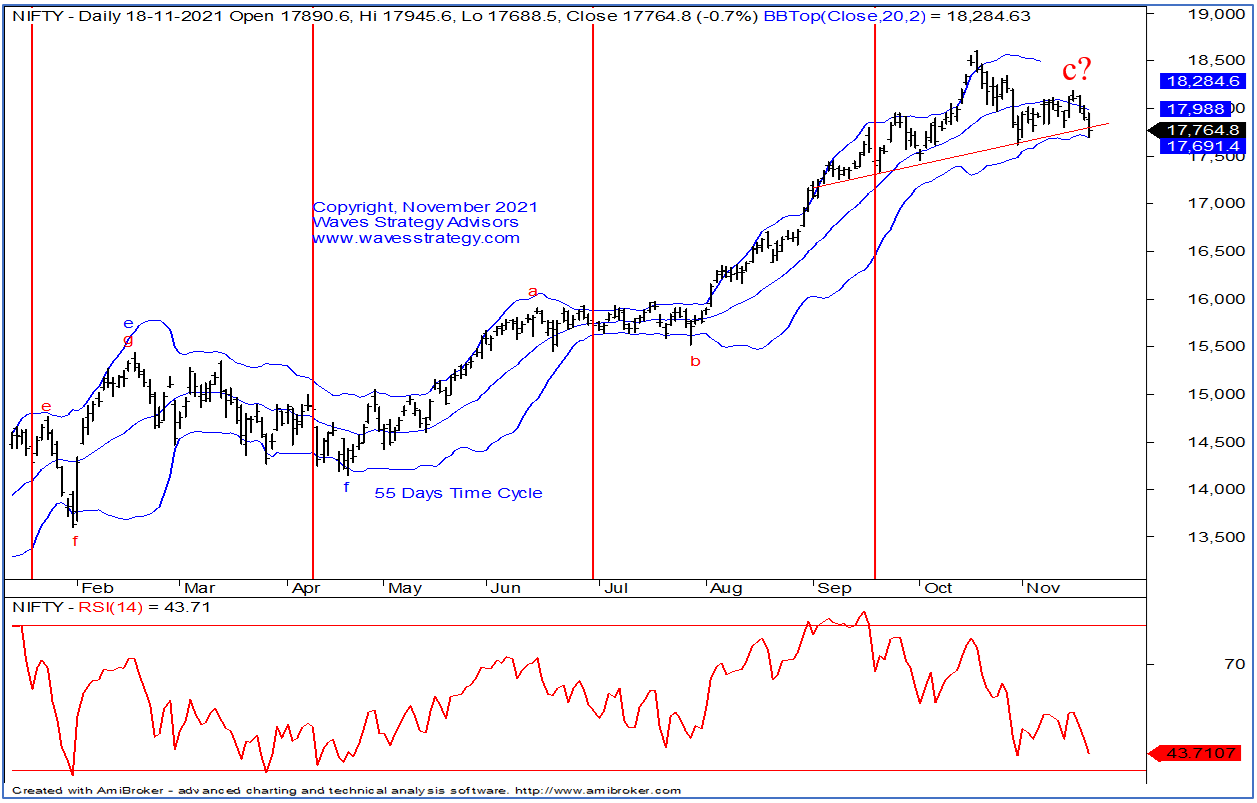
Nifty Daily chart (18th November 2021):
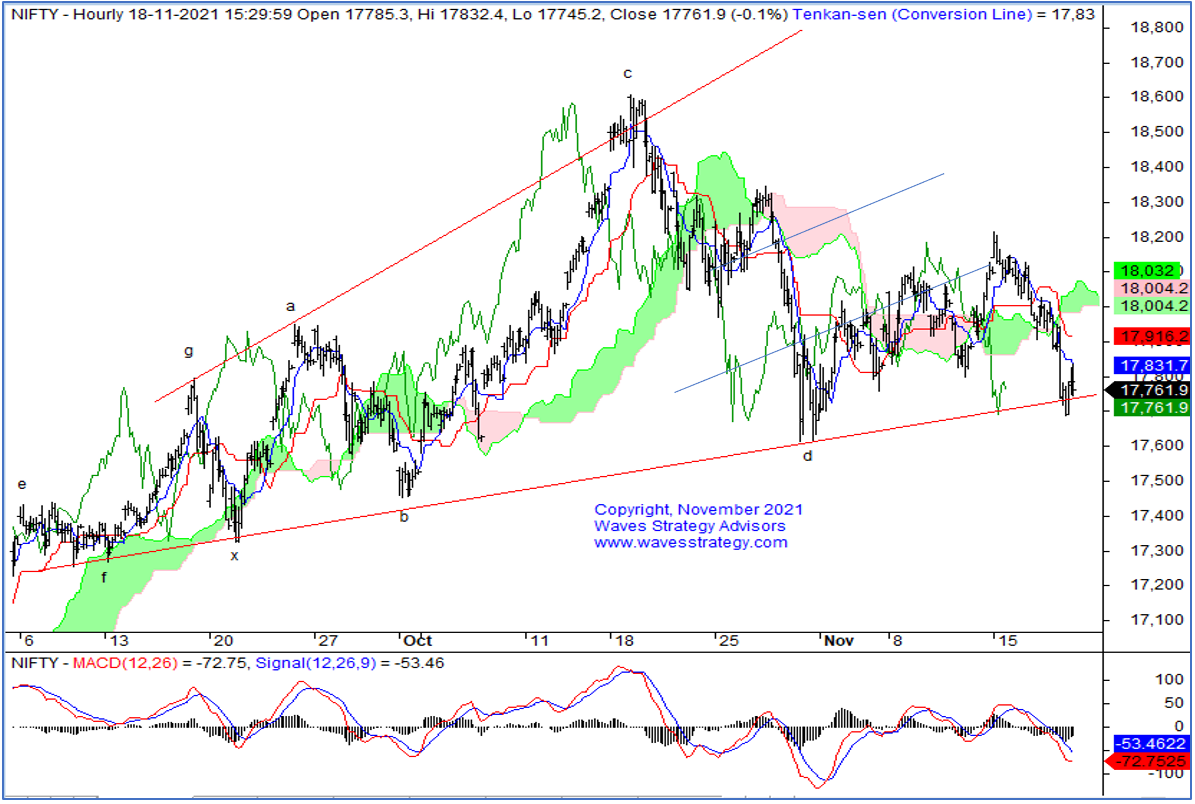
Nifty 60 mins chart (18th November 2021):
Wave analysis: Following was mentioned in the morning research report before markets opened
On the weekly chart of Nifty, prices found rejection near 18200 levels in start of the week and since then it has gone through downward trajectory. In this fall, it has taken out the lows of prior week of 17798 levels and formed bearish candlestick pattern. This has turn weekly bias on downside. At the same time, weekly MACD has also given negative crossover which hints towards weakness might continue from hereon.
On the daily chart, it is for the 3rd consecutive session wherein prices have formed bearish candlestick pattern. As per bar technique, it is failing to move above the highs of prior bar, so as long as this continues, daily bias will remain on downside. As per this, 17945 is the important resistance. Now prices have approached towards the neckline of the Head and Shoulder pattern and at the same time it is testing lower Bollinger bands. Thus any close below 17700 followed by violation of prior swing lows of 17613 level will form lower highs lower lows pattern and suggest further weakness is building up.
On the 60 mins chart, prices have taken out the last leg of down move below 17798 levels and closed below the same. This suggest that minute wave e of Neutral Triangle Pattern has completed at the highs of 18207 level. Further confirmation of the same we will get below 17613 level. It has also violated the Ichimoku Clouds which is a sign of negativity whereas Bollinger bands has expanded on downside which indicates trending move on lower side is ongoing. One can use middle bands as an immediate resistance point which is placed at 17900 level. On higher side, 18130 will act as the big hurdle now.
In short, Nifty is on verge of breaking below the H&S Pattern. Break below 17700 followed by 17613 level will confirm this and suggest that wave d on daily chart has started. On a conservative basis, prices can move lower towards ………………. zone where equality with the fall from 18604 to 17613 level is placed. Any move beyond the same will open target towards …………. level where 50% of the prior rise from 15513 to 18604 level is placed.
BANG ON!
Happened: Nifty 60 mins chart (22nd November 2021):
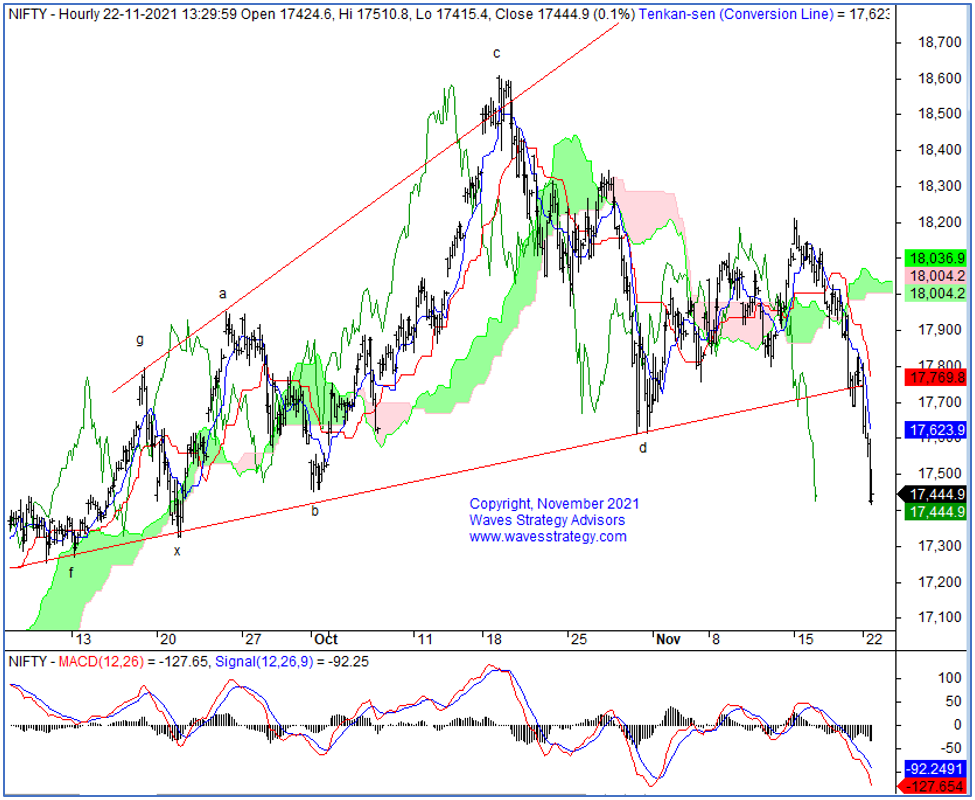
Happened: Nifty moved precisely as expected. After breaking below 17700 – 17600 levels there is a crash and prices are down more than 350 points. When was the last time such a big decline was seen despite of the ongoing euphoria!
Many retail traders are now trapped and we have also published in our latest webinar why it is time to keep riding the trend on the downside. Here is the link if you missed seeing it check here
Time Traders – Our Mentees and subscribers were already aware about such possibility once the key support level breaks and they are placed in the right direction of the market, but are you with them? Get onboard for the Become Market Wizard (BMW) Season 3 which focusses on Option Trading using Technical Analysis (OTTA) and Master of Waves (MOW). Trust me only Elliott wave and Time techniques can help you to forecast markets and today’s move is classic for any trader to make most out of it. Do not miss out on this move, Learn and Trade. Know more here
Subscribe to Nifty, Bank Nifty, Stock calls and get research reports free along with it. Ride the ongoing trend and this can be the start of a Bear market – Act now, subscribe here