Nifty Neo wave – Diametric pattern with Open Interest profile
Oct 31, 2022
Like this Article? Share it with your friends!
Nifty finally managed to touch 18000 levels again. It has taken lot of time but still the undertone is positive unless we see close below prior day’s low. This is simple but powerful trend following method using Candlestick.
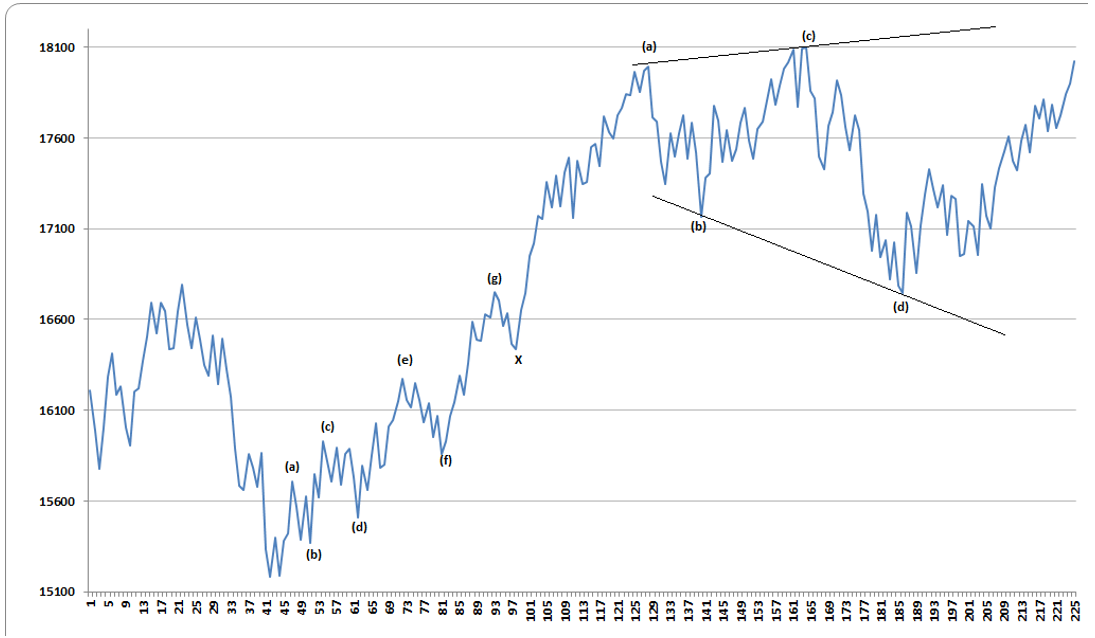
Nifty Neo wave plot
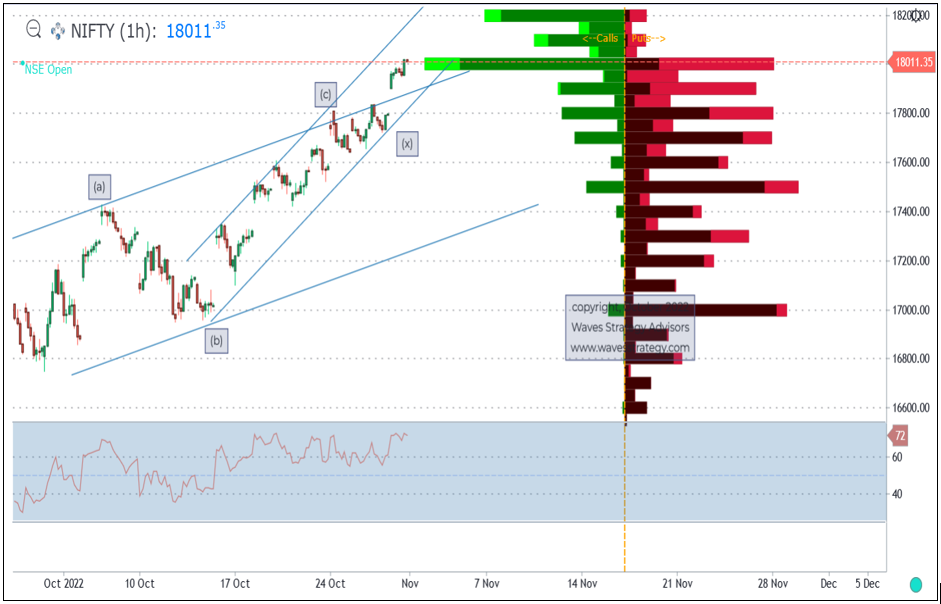
Nifty Open Interest profile 60 minutes chart
Nifty first chart shows a Neo wave plot. This is different than the regular Line or Candlestick chart. This chart helps Neo wave practitioner to see the pattern with much clarity and decide the maturity of the trend. As we can see the entire rise on upside is in form of double corrective pattern with currently Diamond shaped pattern possibly going on. Diametric is a 7 legged corrective pattern and we are in wave (e) of this pattern. Post completion of this wave (e) we will see contracting behavior within a range. Thus by understanding the pattern under formation it is possible to trade
Open Interest profile – shows huge buildup both on call and put side OI. There is possibility that short call options are forming strategy by shorting puts thereby forming straddle positions. Further hourly close above 18060 will extend this up move but any reversal back below 17920 will trap the late entrants.
In a nutshell, by using Advanced Elliott wave – Neo wave method and combining the same along with Open interest analysis one can trade extremely well especially in Options.
3 Months Mentorship on Trading November 2022 – Learn the science of Trading with complete Handholding, lifetime access to exclusive private telegram groups, Exclusive monthly webinars even after 3 months of Mentorship and much more. Fill out the form below for more details