Nifty Gann with 18 Days Time Cycle and Trendline Indicators
Nov 14, 2022
Like this Article? Share it with your friends!
Gann, Time Cycle and Trendlines are excellent tools that one can use from Technical analysis.
Here we are applying these concepts on Nifty to see the possible area of reversal, support, entry and exit strategy.
Nifty Daily chart:
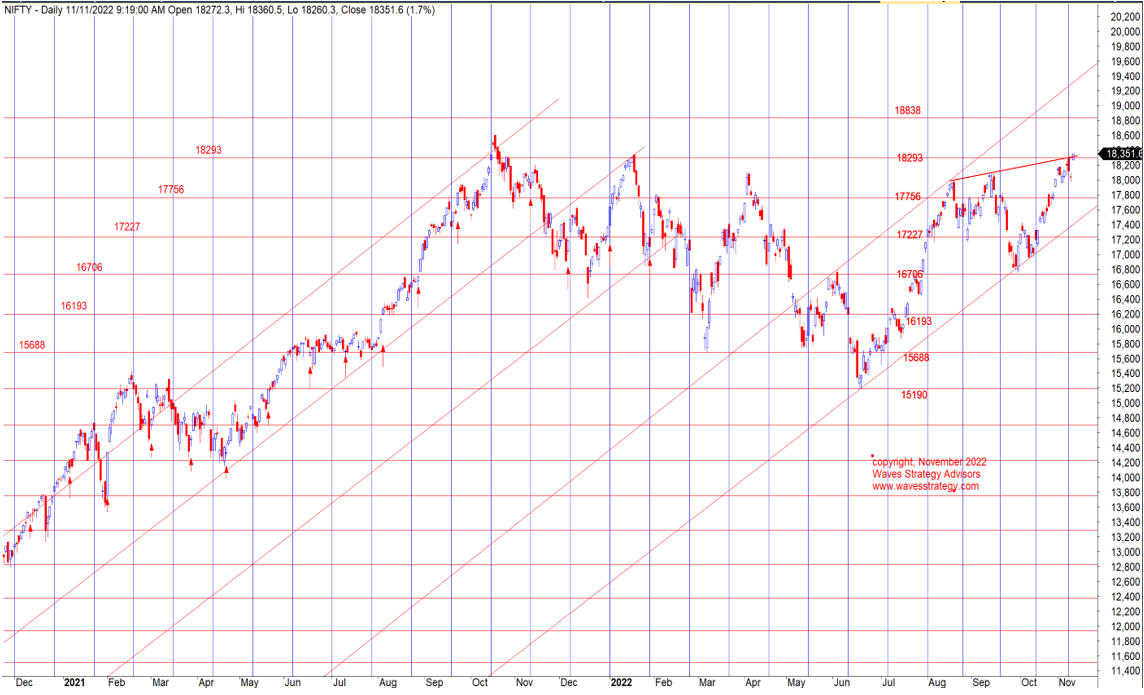
Above chart of Nifty shows horizontal lines which are Gann square of 9 levels derived from 180 degrees angle.
We can see that these levels have been acting as important support or resistance and on most of the times when each resistance is taken out there is an attempt to retest this level before prices eye for next upper level.
As of now, Nifty is flirting around 18293 Gann square of 9 level. Post breaking above this level there is tendency for the same to act as magnet and we can see it will become like a mean reversion level. Option sellers can therefore make most of this information and accordingly select strikes to form strategy.
18 Days Time cycle – The vertical line represents Time cycle and we use this to identify possible time reversal. However, this cycle has to be used along with Gann support levels as 18 Days time can be a tricky cycle period. Only someone who understands the rhythm of time correctly should dwell into this time cycle. We can see important lows forming on this time cycle provides classic opportunity to catch reversal for Time Traders.
Trendlines – We have shown parallel trendlines that has been working very well. The slope of the trendline has not changed when compared to the prior period of rise during 2021 and the current rise is also at the same angle of trendline. Infact, for drawing a trendline the angle of ascent is more important than the two points to draw it. So, a trendline can be drawn even on a single point if one is aware about the correct angle of ascent as shown in above chart. This angle is nearly 60 degrees.
In a nutshell, Nifty can consolidate in a narrow range for a few days and possible retest 18293 level before inching back higher The next level will get activated only once we see consolidation and dip to the mean revert level of 18293 as it is required for base formation or accumulation. Also 18100 should remain intact else Nifty will fail to move higher.
Gann, Time Cycles and Trendlines understanding the angle is powerful way of Trading and above shows just a glimpse on how these techniques work.
Mentorship on Timing the market – 3 Months of complete handholding with above techniques of trading along with Elliott wave, Neo wave and simple step by step approach with Algo creation, stock selection for Momentum and Multibagger stocks will be covered in Mentorship. Time is now to become profitable trader. Fill below form for more details: