Nifty: Why 17050 Should Not Break! 17280 major Hurdle!
Apr 18, 2022
Like this Article? Share it with your friends!
Nifty had a big gap down opening today and prices continued to move lower sharply after the opening tick. During such scenario a trader needs a clear plan, trade setup for trading else can get trapped on the wrong side.
Nifty has been falling after touching a high near 18100 levels where we have been cautioning our subscribers and the markets reversed back sharply from there. So in this trend one needs to be aware about key levels.
Nifty Volume profile and Neo wave 60 minutes chart:
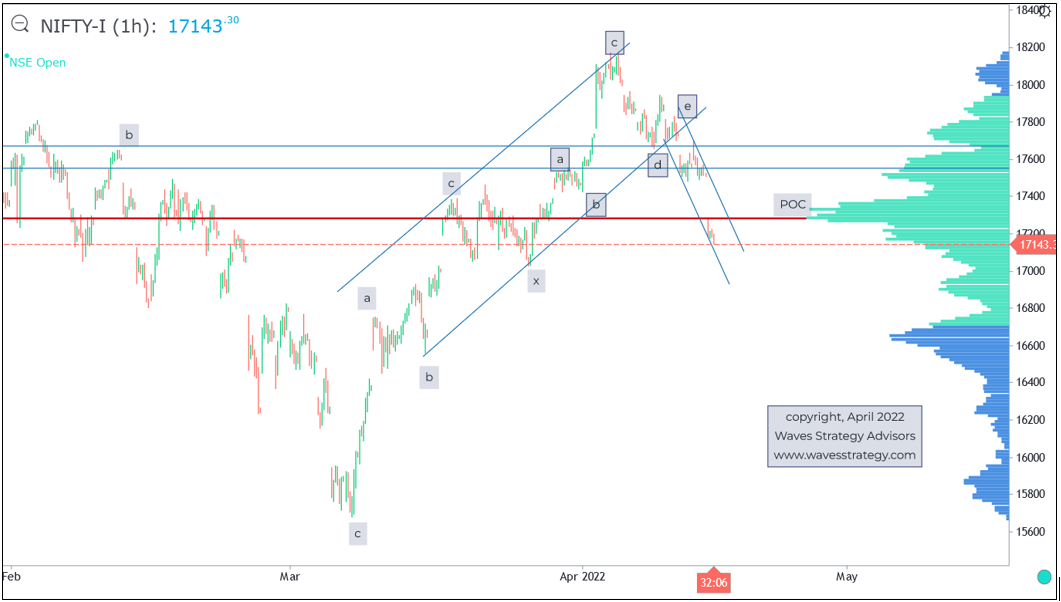
Nifty is currently moving lower and has broken below the Volume point of control (VPOC) which is the level where major activity has taken place. This move down is with a big Gap and since then there is no attempt to cross back above it. So a move above 17280 is must for short term pullback and also understand this level acts as a magnet. Nevertheless, it is prudent to be placed in the direction of the trend which is down and use pullbacks as opportunities to short.
On downside, 17050 is now the important support as this is the low of wave x. Prices usually respect the levels of x waves and so this is the final line in the sand and if the same is taken out any pullback can be short lived. Today’s close is going to be important and let see if 17050 can remain protected on closing basis.
Prices after completing the double corrective pattern on upside is now moving in the form of next leg lower. It is best to use pullbacks to short as the next major support for market below 17050 is near 16600 level the next highest Volume profile area.
Options Trading Using Technical Analysis (OTTA) and Master of Waves (MOW) is starting this weekend on (OTTA) 23rd – 24th April 2022 followed by Master of Waves on 28th – 29th May 2022. OTTA will cover important aspects of Options trading using Pay off charts, clearly defined trade setups, Indicators, Moving averages and much more directly applied on Options chart for Option buy and sell strategy. Fill the below form to know more: