Nifty’s next move simplified with the help of Open Interest Profile
Oct 09, 2025
When Open Interest analysis is combined with price action it can be used in identifying key reversal points and crucial support zones.
Options Trading requires understanding of momentum, trend, time to expiry and range. Hence it becomes utmost important to know how to interpret Open Interest data.
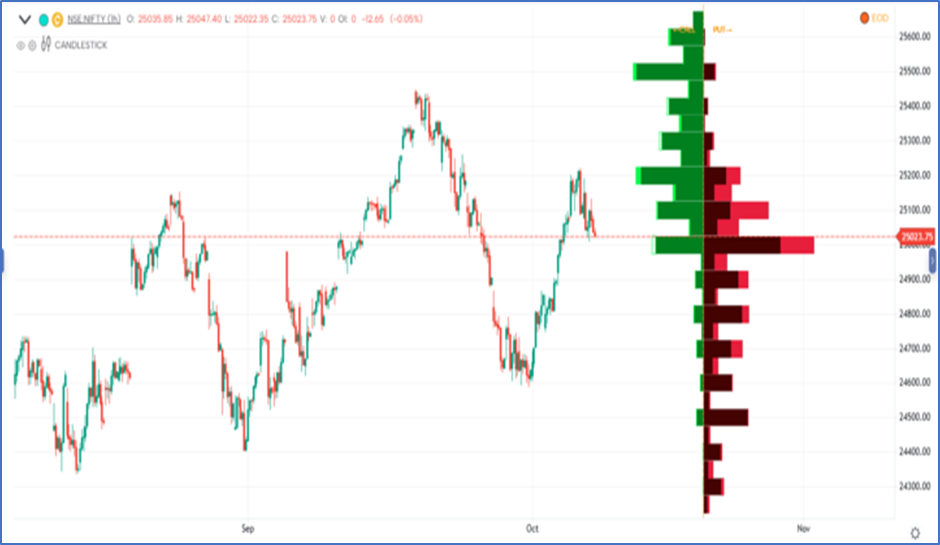
Nifty Hourly chart with OI Data
 Open interest - Open Interest represents the total number of active (outstanding) contracts. This analysis gives traders an additional advantage for forming a powerful options strategy.
Along with this, it is important to understand that OI Data is also interpreted from the seller’s perspective which provides traders the insights about the big player activity in the given stock/index.
As shown on above chart, the left side green build-up is indicating Call open interest and right-side red build up shows put open interest. We can see that 25000 has the highest Put Open interest (red side) so for the Index to break below it is not going to be easy. On the upside, 25200 levels has the highest call side Open Interest (green side) which acts like an important resistance for the Index.
In a nutshell, So, for now, we can expect range bound action in the Index between 24980 to 25220 level. A decisive break above 25220 levels can resume bullish momentum in the Index. On the downside a break below 24980 can put short term pressure. With this information, one can clearly form option strategy in direction of big players by looking at Open interest profile.
Brahmastra (Mentorship on Timing the market) – Learn to trade the market with an edge of Time cycles, Elliott wave, Neo wave concepts ,Options strategy with 5 mantras of option trading, Open interest and volume profile, access to a private community group, stock selection scanner, Multibagger and Momentum stock identification technique, Mentorship sessions for the complete trading journey.
