Option Trading Using Open Interest, Channels and Candlesticks!
Apr 04, 2022
Like this Article? Share it with your friends!
Option Trading Using Open Interest, Channels and Candlesticks!
Options are powerful trading instrument if one knows to use them correctly and understand what is happening behind the scenes by looking at Open Interest profile.
Nifty showed a sharp rise of more than 350 points in single day on back of merger news between HDFC and HDFC Bank which will create third largest market cap based entity in India.
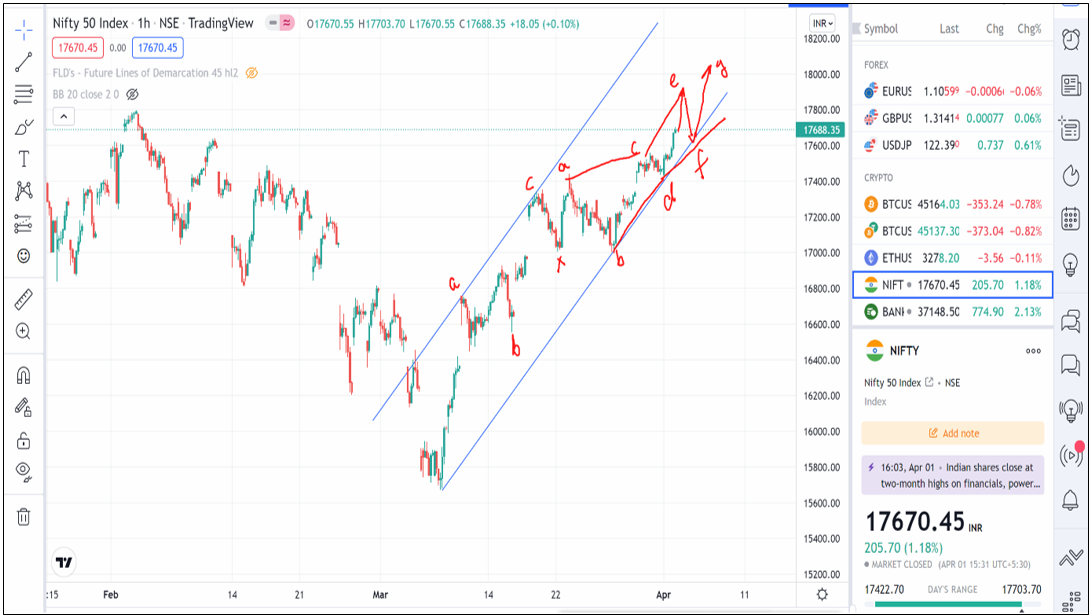
For trader it is important to see the charts as news will not help into taking trading decisions. Below chart of Nifty shows that the up move was already predicted in the webinar on 1st April 2022 along with blueprint of market based on Elliott wave analysis.
Nifty hourly chart path ahead shown on 1st April 2022 webinar on YouTube:
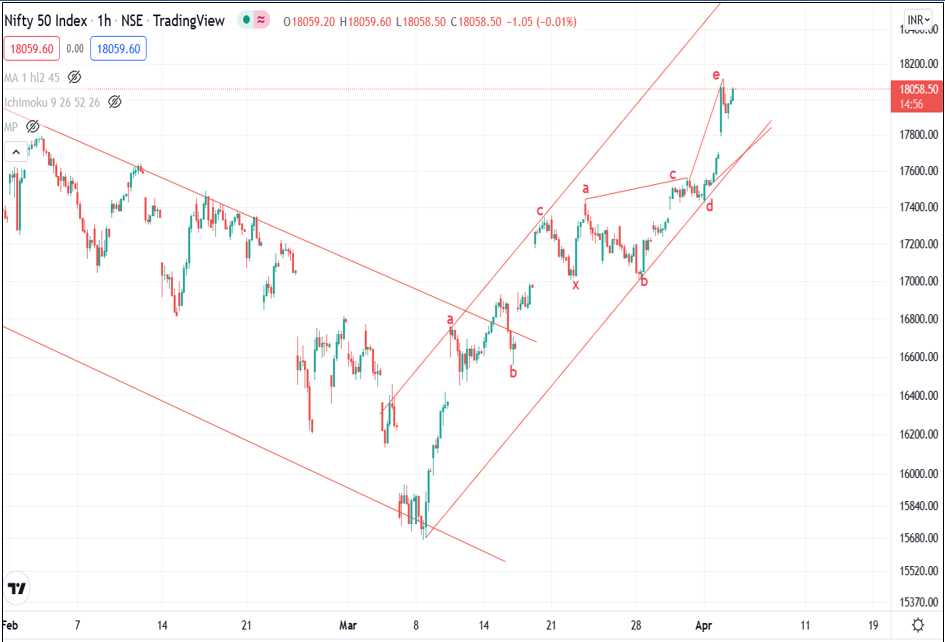
Happened:
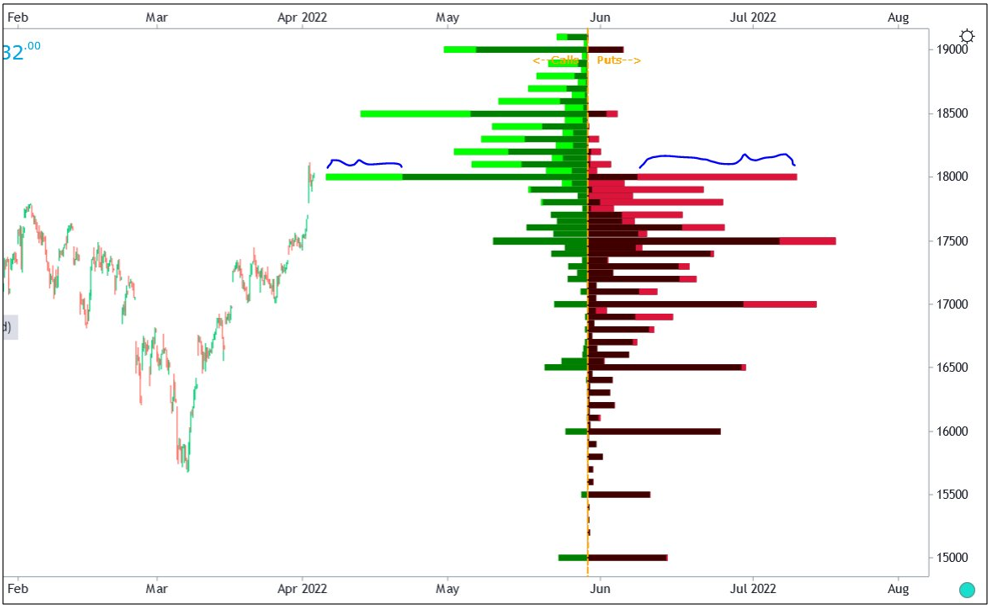
Nifty Open Interest Profile:
Elliott wave analysis: As shown in the first chart we expected Nifty to start wave e on upside in the ongoing move and Friday was ideal day to go long. We even gave buy to Intraday and Positional trades which worked out very well on 1st April. This chart was shown in YouTube webinar here is the link to refer
Happened: Nifty behaved precisely as expected and moved higher. Due to the news or event of HDFC merger with HDFC Bank the move was sharp and with a Gap. So the trend followed is precisely as expected with upward thrust as shown by Diametric pattern. This is the power of knowing Elliott wave
Nifty Open Interest profile – It is important to keep track of Open Interest and see what the option traders are doing. This chart shows call sellers at 18k strike are still not squaring off their positions and we see addition by put sellers as well at 18k strike. This is suggesting that there is a short straddle in play which is selling options of both calls and puts for ATM strikes. This happens when Option traders expect markets to be in a range for few days. Looking at this data and seeing that the Elliott wave pattern there is possibility that wave e will complete near 18100 levels and we can start seeing wave f formation resulting into a consolidation possibly. However, as the tone is on the buy side one can also use dips to create longs by way of selling puts.
Thus by combining Elliott wave analysis and Open Interest profile one can form amazing trading strategy may it be directional or non-trending using Options.
Become Market Wizard (BMW) – Learn the science of Options Trading using Bollinger Bands, Candlesticks, Moving averages in Option Trading using Technical Analysis (OTTA) and combine this will Elliott wave in Master of Waves (MOW). This is simple, step by step approach for trading and can be opted by even freshers, students, house wife looking forward to generate passive source of income by way of trading options, even expert traders can opt for it to increase their trading accuracy and consistency. Both OTTA and MOW combined together we call it as BMW program. Know more here