
PB Fintech: Key Levels Revealed by Volume Profile & Gann
Aug 17, 2026
Markets leave footprints before every major move. The key is knowing how to read them while Gann Square of 9 helps identify important price levels, simple price action combined with Volume analysis can provide clear guidance for trading in stocks over short to medium term.
Let's understand the chart of PB FINTECH Ltd and see what these two powerful tools are indicating for the stock's next move.
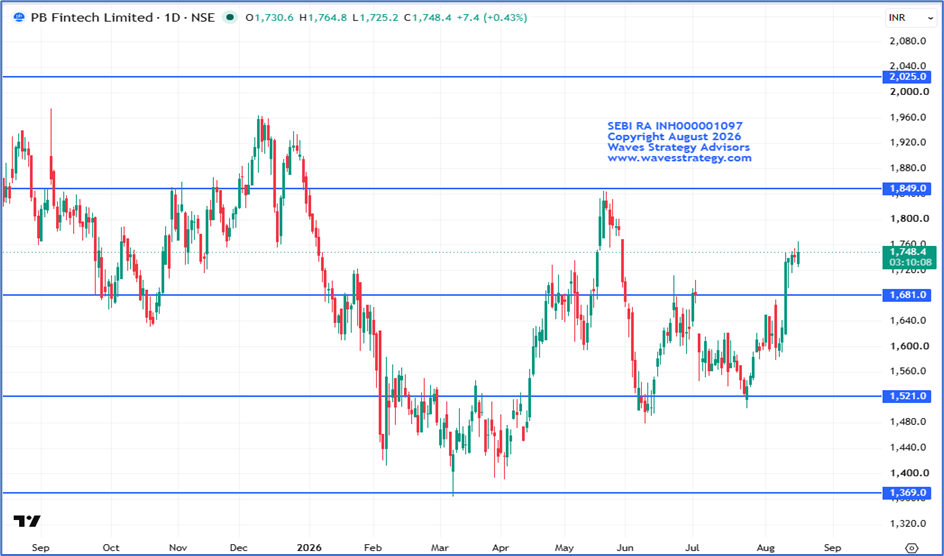
PB FINTECH Daily chart with Gann Square of 9
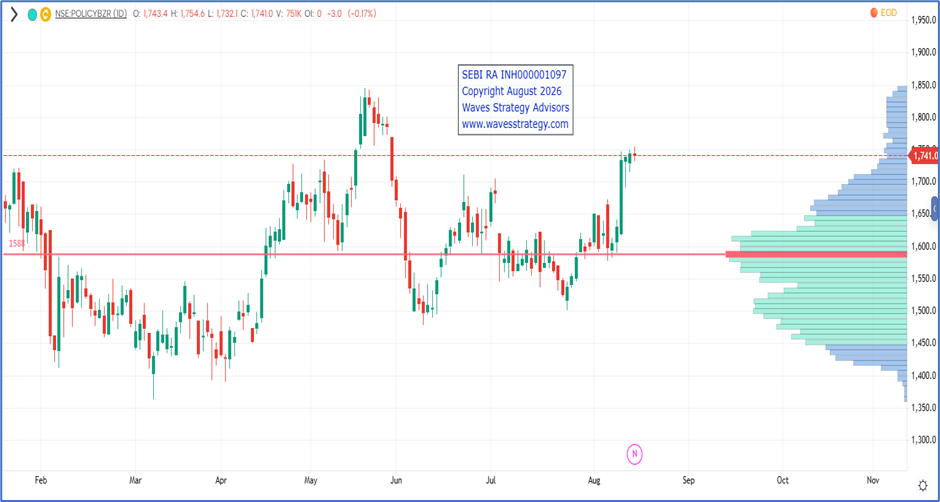
PB FINTECH Daily chart with Volume profile
Gann Square of 9
- The Gann Square of 9 is a simple yet powerful tool for identifying key support and resistance levels, based on the principle that price moves in mathematical harmony. Certain levels act as magnets until they are decisively broken.
- This helps a trader in identifying probable price targets and even market turning points.
- 1681 Gann level has acted as a strong resistance, with the stock trading around this level since 22nd June 2026.
- On 11th August the stock surged nearly 5% and broke above the 1681 Gann level, indicating renewed bullish momentum.
- This breakout above 1681 level strengthens the positive outlook and also suggests the stock could continue moving higher.
Understanding Volume Profile
- Volume Profile is an advanced analytical tool that displays the price levels where significant trading activity has occurred.
- It helps traders identify areas of high and low market participation based on trading volume.
- POC represents the price level with the highest traded volume. It acts as a magnet level, where the price tends to revisit frequently.
- It can also help tp identify strong support and resistance zones and can improve entry and exit precision.
Combining Volume Profile & Price Action
- Combining Volume Profile with basic Price Action significantly improves trading accuracy.
- This approach is beneficial for all traders, whether they are beginners or experienced market participants.
- Before applying this, it is essential to understand both tools individually. As proper understanding of these concepts helps traders interpret market behaviour more effectively.
Conclusion
- Recently, stock tested POC level on 6th August 2026 near 1588 levels and reversed sharply on the upside which is a positive sign and also highlights reliability on POC level which has acted as a strong support level.
- Price action, Volume Profile and Gann Levels point towards a strong setup.
- For now, break above day high near 1765 can be considered as a buying opportunity to participate in the ongoing uptrend.
- The next key resistance is placed at the 1849 Gann level with support being around 1590 level.
Brahmastra (Mentorship on Timing the market)
Learn to time the market to the very Day, Hour and Minute by combining the concepts of Hurst’s Time cycle on Index and stocks as well, Gann square of 9, Elliott wave, Neo wave and be a part of elite trader’s community who are Time Traders.
Fill the form now
3 Months of TRISHUL Membership (Options Mantra + Elliott Wave + Neo Wave)
Trishul Membership – Options Trading with Elliott wave, Neo wave, Ichimoku cloud, and sacred science of trading & forecasting is covered in the Options Mantra Live Sessions - 12th - 13th September & Sutra of Waves Live Session - 10th - 11th October 2026. Limited seats available.