
PNB: The 41 - weeks Time Cycle worked perfectly in key market phase!
Nov 10, 2026
Most traders grow up hearing that timing the market is impossible. However, Time Cycle analysis proves otherwise. Markets move in rhythmic cycles, and these cycles often repeat with remarkable consistency across instruments and timeframes.
Combining Elliott Wave Theory, price action, Time Cycle and AK Indicator helps traders identify high-probability setups. By aligning wave structure with real-time price action, traders can filter market noise and focus on capturing the strongest part of the trend.
See the detailed research below on PNB how it has worked out perfectly.
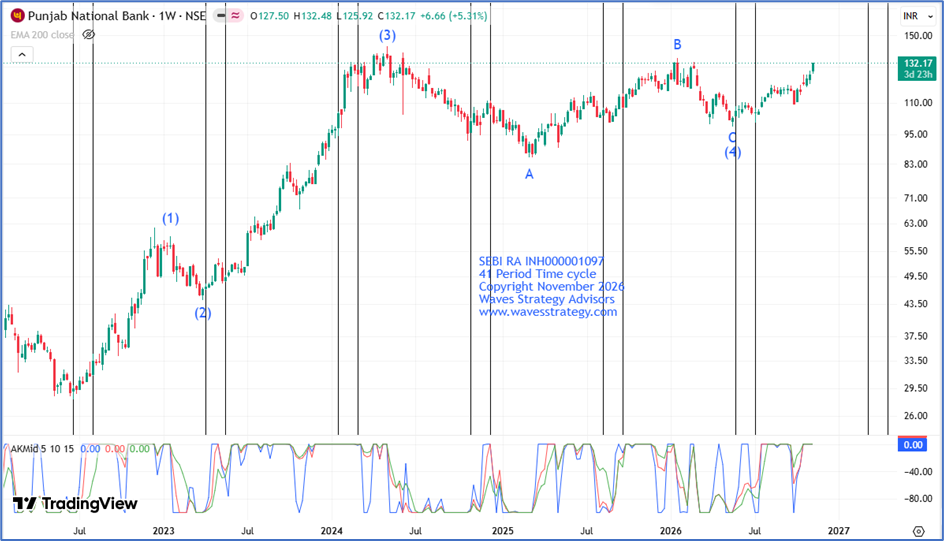
PNB Weekly chart with Time Cycle, Elliot Wave & AK Indicator
Price action Analysis
- Punjab National Bank has been witnessing a consistent uptrend since 6th July 2026, indicating strong buying interest near support levels.
- The stock continues to form higher highs and higher lows, confirming its bullish trend structure.
- Also, it has witnessed a strong breakout above its previous resistance zone around 120.
- Since the breakout, every candle has managed to close above the prior day's high, reflecting sustained buying momentum.
- The stock's ability to sustain above the breakout zone further strengthens the bullish outlook.
- Overall, the technical structure remains positive, indicating potential for further upside.
Time Cycle
- The stock is currently following a 41-week Time Cycle with the latest cycle running from 25th May to 6th July 2026.
- During this period, stock formed a short-term low near the 100 level. Since then, prices have been moving upward and currently trading near prior swing high of 136 level.
- For now, breakout above 136 level could turn the cycle on buy side.
Wave Analysis
- Prices can be observed following the classic Elliott wave theory since June 2022.
- In which post completing the Primary wave (3) back in 2024 prices recently completed its Primary wave (4) on the downside near the 100 level which was in the form of C Failure Flat corrective pattern.
- Current rise ongoing in the form of Primary wave (5) pattern.
AK Indicator
- The AK Indicator is a custom-built tool used to track trend maturity, momentum and trend strength.
- On the AK Indicator, currently all three lines have started trading on 0 line, providing double confirmation. This suggests that bullish momentum is likely to continue.
Conclusion
- Time Cycle, when combined with simple price action and AK Indicator, can provide powerful trend signals.
- A decisive move above 136 can extend this rally further towards 155 or higher.
- On the downside, 120 remains a crucial support level to watch in the near term
Kaal Chakra
Master of cycles: Be a part of elite trading community who trades time by combining the concepts of Hurst’s Time cycles along with Gann square of 9. Live sessions on 28th – 29th November, Application of time trading, deriving targets using time, stoploss management with list of stocks along with time period. Act now, Limited seats only – Know More
3 months of Mentorship (Brahmastra) on Timing the Market
Apply Time cycles with Elliott wave, Neo wave, stock selection, risk management strategy, exclusive mentorship sessions & trade like a pro. Limited seats, Fill below form for more details.