
PNBHOUSING Near Breakout: What Time Cycle & KST Signalling?
Oct 12, 2026
Time Cycle analysis, when combined with price action and time-cycle with KST indicator, can provide a structured framework for identifying potential market turning points and high-probability trade setups. This integrated approach helps traders assess market structure, timing, momentum, and possible trend reversals, offering valuable insights for short- to medium-term trading decisions and risk management.
Capture short-term market momentum using the powerful combination of Elliott Wave, Time Cycles, and Price Action to identify potential trading opportunities before the next move unfolds. Vayu Momentum Report.
PNBHOUSING Daily chart with Time Cycle
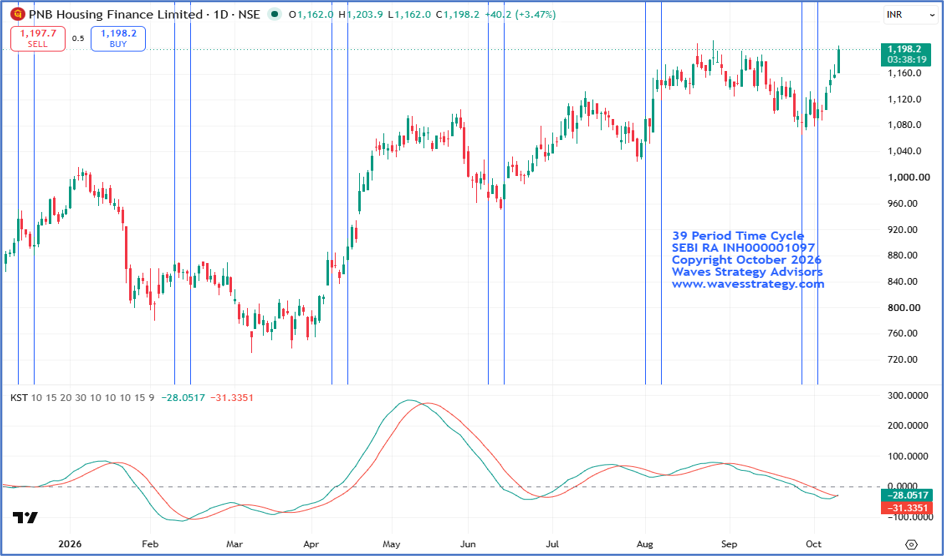
PNBHOUSING –39 Period Time cycle
- The stock has been consistently respecting the 39 Period Time Cycle, forming lows near cycle dates and reversing on the upside.
- The latest cycle occurred on 28th September 2026, followed by a rally of more than 12%, highlighting the cycle’s significance.
- The stock has witnessed a strong recovery since the latest cycle low, indicating improving buying momentum.
- Prices are now trading near the previous swing high of 1212, an important resistance level.
- A decisive breakout above 1212 could strengthen the bullish setup and shift the cycle to the buy side.
Combining Time cycle and KST indicator
- Combining both indicators can help traders identify momentum shifts that are often overlooked.
- The KST indicator helps assess the overall strength and direction of price momentum.
- Recently, the KST line crossed above the Signal line from below and is moving towards the zero line.
- A breakout above the zero line could further strengthen bullish momentum and signal a potential upside move in the stock.
Conclusion
- Price Action, Time Cycle, and KST indicator are aligning to indicate a strong bullish setup. The combination of a favourable price structure, cycle-based reversal signals, and improving momentum supports the positive outlook.
- A decisive breakout above 1212, the previous swing high, could confirm bullish strength and open the possibility of an upside move towards the 1270-1290 level.
- Immediate support lies near 1160, which coincides with the previous swing low. Holding above this level will be important to maintain the current bullish structure, while a breakdown could weaken the setup.
Learn Advanced Technical Analysis with Brahmastra
Brahmastra — Technical Analysis Mentorship
Learn the science of trading with algo creation, stock selection, options trading, Elliott Wave and Neowave.
In the Brahmastra sessions, you will learn how these concepts can be combined to develop a structured approach to market analysis and trading. Fill below form for more details: