How to Capture a Big move using EW, Simple Chart Pattern and Indicator.
Dec 30, 2022
Like this Article? Share it with your friends!
While trading the market it is important to understand the behaviour of the market. Using price action along with simple Elliott wave theory we can predict price moves in stock with high accuracy. Check out how we recently identified one such breakout in PONNIERODE
We used these 2 indicators on PONNIERODE and were able to capture a 16% move in a single day. You can also use these to identify stocks with momentum for short-term trades.
We published PONNIERODE analysis in "The Financial Waves Short Term Update" on 29TH December which our subscribers receive pre-market every day. Check out below the detailed research report that we published.
PONNIERODE Weekly chart as on 29th December 2022: (Anticipated)

PONNIERODE Weekly Chart as on 30th December 2022: (Happened)
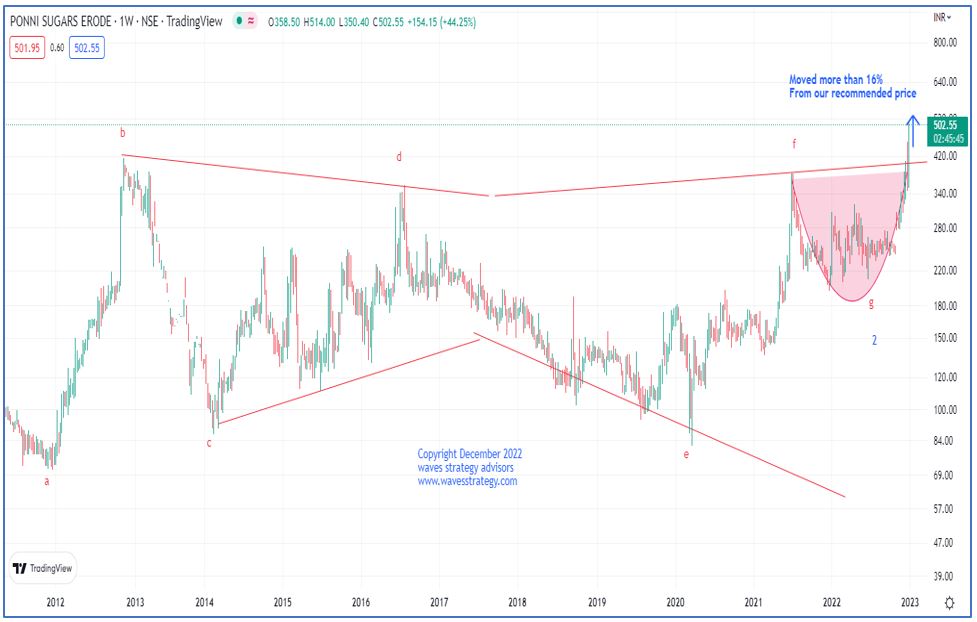
Wave analysis as on 29th December 2022:
PONNIERODE has been moving higher recently and intact in strong uptrend. In the previous session it closed with a loss of -2.48%.
On the weekly chart, in the previous session prices formed a bullish candle. Prices has recently given breakout of rounding bottom pattern at 380 levels and now it has retest to the same breakout level hence it is expected to move higher. We have shown ADX indicator which gives an indication if the stock is trending or in a trading range. The low readings of ADX indicates that the stock is in a range. The adx of this stock is 40.38 giving an indication of a trending market. The reading above 25 means strong directional strength.
In short, trend for this stock is positive. A break above 440 can lift price higher towards 485-490 as long as 415 holds on the downside.
Happened:
The stock moved as we expected and have given breakout of rounding bottom with huge volume followed by simple Elliott wave theory which helped us to catch a big move of more than 16% in a single day.
Currently, Primary wave 2 looks to be completed and the current rise is in form of Primary wave 3 which is considered as a strongest one.
Subscribe to “The Financial Waves short term update” daily equity research report that covers Nifty, Bank Nifty, stocks providing good trade setups on daily basis. Subscribe here
Be a part of Master of Waves on the 7th and 8th of January which will focus on the Elliott wave, Neo wave, Hurst’s Time cycles, and also a special section on Trading using Gann square of 9. Be a part of this Elite Trading Community #wavetraders. Limited seats. Fill out the form here for more details