Power of Neo Wave
Mar 18, 2021
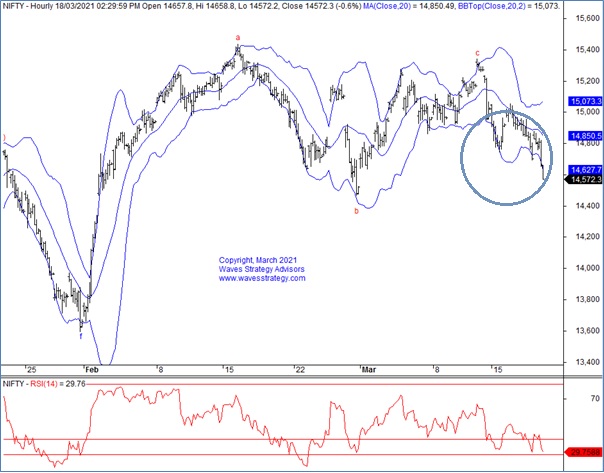
You can see slowly and steadily Nifty has been drifting lower but the move has been very much predictable.
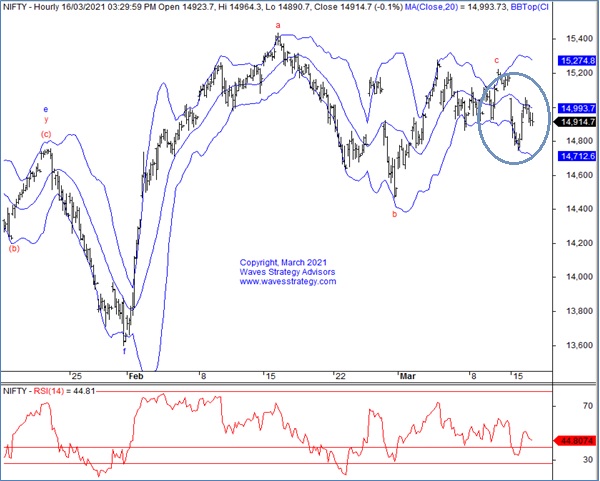
Look at the below chart of Nifty published in the equity research report on 16th March morning before markets opened – “The Financial Waves short term update“
Nifty 60 mins chart: (Anticipated as on 16th March 2021)
Nifty 60 mins chart: (Happened as of now)
Wave analysis: Following was mentioned on 16th March when the index was was near 14914 levels.
Wave analysis:
Nifty opened with a gap of 70 points. The index moved in a lackluster fashion through the day. Overall Nifty closed on a flat note near 14910 levels. The market breadth was slightly bearish with 1497 declines against 1466 advances. Sector indices closed on mixed notes with the IT sector being the top gainer and Banks dragging the index lower.
On the daily chart, Nifty formed a small red body candle with majority of its range almost within its range contained within the prior candle. As per the bar technique the short term bias continues to remain bearish as long as we do not see a close above the prior day high. We can clearly see range bound movement between the Bollinger Bands range for many days now. Even stock specific breakouts are not working out .The current market scenario is great for option writing rather than option buying unless a clear trend emerges , which should happen very soon.
On the hourly chart currently it’s a triangular activity ongoing which is resulting in very choppy price movement. Prices can either be in wave d which is still ongoing or wave e of the triangle has possibly started. Break below 14750 will keep the short term bias negative whereas on the upside we need a decisive break above 15100 for a positive move. 15100 is also the level of high volume profile area and price has been whipsawing up and down around that zone itself. Its wait and watch for now for a bearish trend to emerge.
The 18th march weekly option data suggests if price sustains above 15000 at least for an hour then we can expect short covering in the index which can lift the index higher by 100-120 points, whereas a decisive move below 14800 can result into long unwinding which can drag Nifty lower towards 14650-14700 levels.
In a Nutshell a triangle formation is unfolding in Nifty as of now. A break below 14750 can result into a short term downmove. Whereas a break above 15100 can lift price higher towards 15250 levels.
Happened: The Index performed precisely as expected recently on 17th March the price has made its low near 14554 levels.
Subscribe to the Intraday / Positional calls on Nifty, Bank Nifty, Stocks Futures and Options and get free research report along with it. Get access here
Trade with me – 3 months of Mentorship starts in 3 Days – “Life transformation” is what most of our existing mentees have been calling the program. Capture the big trends using simple ways of understanding institution activities which had been available only to a limited few so far. Take this leap for the lifetime investment. For more details contact us on +919920422202