Most Traders Ignore This Powerful Indicator. Are You One of Them Too?
Mar 30, 2026
Simple price action combined with Volume analysis can provide clear guidance for trading in stocks over short to medium term.
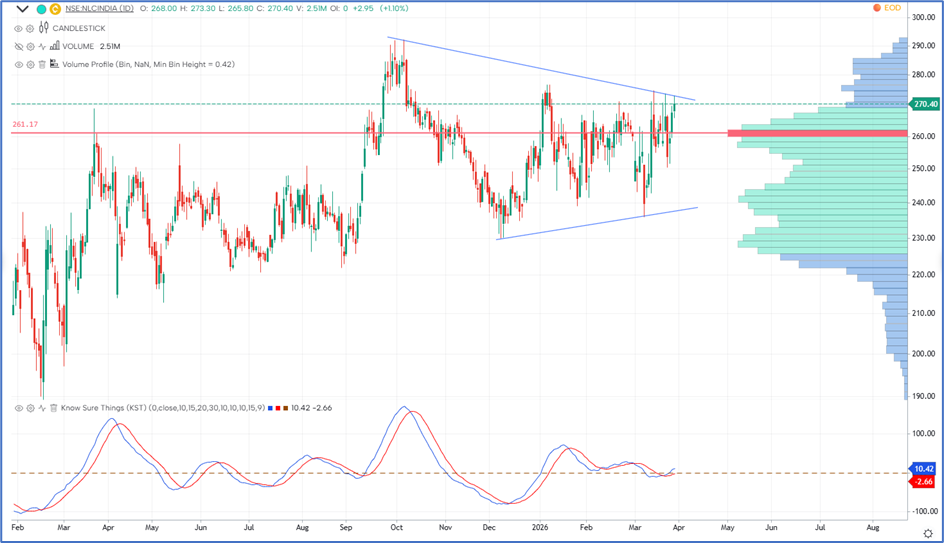
NLC India Daily Chart with Volume profile and KST indicator
Importance of Combining Volume Profile & Price Action
- Combining Volume Profile with basic Price Action enhances trading accuracy.
- This approach is useful for all traders, whether beginners or experienced participants.
- Before applying the strategy, it is essential to understand both tools individually to interpret market behavior effectively.
Understanding Volume Profile
- Volume Profile is an advanced analytical tool that shows price levels where significant trading activity has occurred.
- The most critical component is the Point of Control (POC):
- It represents the price level with the highest traded volume.
- Acts as a magnet level, where price tends to revisit frequently.
- It helps traders:
- To identify strong support and resistance zones
- To improve entry and exit precision
- To understand where institutional participation is concentrated
Understanding KST Indicator
- The KST (Know Sure Thing) Indicator is a momentum-based indicator.
- It helps traders assess the overall strength and direction of price movement.
- Key signals:
- When the KST line crosses above the Signal line → Early sign of bullish momentum
- When it moves above the zero line → Confirms strengthening bullish momentum
- It is particularly useful for identifying trend shifts and momentum confirmation.
Application on NLC India
- NLC India is trading near the POC (261.17), acting as a strong magnet and key support/resistance zone.
- The stock is forming a Symmetrical Triangle, indicating consolidation with breakout potential.
- KST Indicator supports the setup:
- Bullish crossover (KST above Signal line)
- Approaching zero line → momentum strengthening
- A breakout can drive prices toward 292 and higher.
Final Trading Outlook:
Price action, and indicator alignment point towards a strong setup. The bullish setup is further supported by the KST indicator. A break above the 276 level can push prices higher towards 292 or higher with key support being around minor swing low of 250 level.
Brahmastra (Mentorship on Timing the market)
Learn to time the market to the very Day, Hour and Minute by combining the concepts of Hurst’s Time cycle on Index and stocks as well, Gann square of 9, Elliott wave, Neo wave and be a part of elite trader’s community who are Time Traders.
Fill the form now
3 Months of TRISHUL Membership (Options Mantra+ Elliott Wave+ Neo Wave)
Trishul Membership – Options Trading with Elliott wave, Neo wave, Ichimoku cloud, and sacred science of trading & forecasting is covered in the Options Mantra Live Sessions - 11th - 12th April & Sutra of Waves Live Session - 9th - 10th May 2026. Limited seats available.