RATEGAIN: Combining Rounding Bottom with Time Cycle
May 15, 2023
Like this Article? Share it with your friends!
We had applied ADX indicator on RATEGAIN and were able to capture a 10% move within 4 trading sessions. You can also use these to identify stocks with momentum for short-term trades.
Using price action along with Time we can predict price moves in stock with high accuracy. Check out how we recently identified one such breakout in RATEGAIN.
We published the following research on RATEGAIN in our Daily Equity Research Report on 9th May 2023 which our subscribers receive pre-market every day.
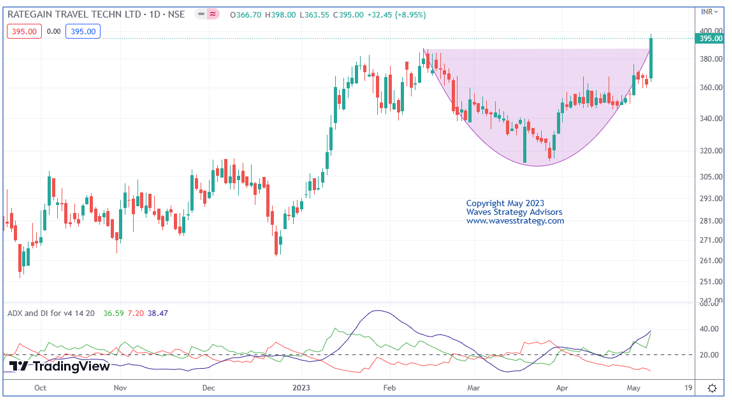
RATEGAIN (Anticipated as on 9th May 2023)
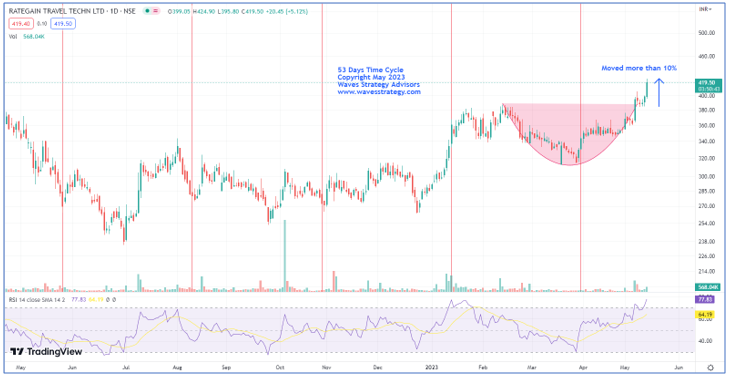
RATEGAIN (Happened as on 15th May 2023)
Wave analysis:
RATEGAIN has been moving higher recently and intact in strong uptrend. In the previous session it closed with a massive gain of 8.95%.
On the daily chart, in the previous session prices formed a bullish candle. Price has closed above 388 level which confirm breakout of the rounding bottom pattern. We have shown ADX indicator which gives an indication if the stock is trending or in a trading range. The low readings of ADX indicates that the stock is in a range. The adx of this stock is 38.47 giving an indication of a trending market. The reading above 25 means strong directional strength.
As shown on the hourly chart, we have applied parabolic SAR which used to determine the price direction as well as draw attention to when the price direction is changing. A series of dots placed below the price which is deemed to be a bullish signal. Closest support is placed at 375.
In short, trend for this stock is positive. Use dips towards 385-390 as a buying opportunity for a move towards 435-440 levels as long as 375 holds on the downside.
Happened
Stock moved precisely as expected and have given breakout of rounding bottom followed by huge volume. We have identified this stock with the help of simple chart pattern along with Time cycle. We have plotted 53 Day’s Time cycle in which it has captured almost all the important lows and recent low made near 314 levels which was captured by our cycle and since then stock has shown an exceptionally well rally.
In today’s session stock has gained more than 10% from the dip levels and made high of 424.90. For now, we can expect this rally to continue. One should avoid catching tops and use dips to ride the trend.
Did you download the app yet where we are giving away strategies simple and easy right from step by step approach to KST trading, to powerful Trade Setups on Nifty, Bank Nifty, Stocks, Elliott wave, Bundle courses and many more at upto 75% off? Summer offer is ending soon!
Download the App now- https://play.google.com/store/apps/details?id=co.lenord.esiad
For iOS click here- https://apps.apple.com/in/app/myinstitute/id1472483563 and enter code: esiad
3 Months of Mentorship on Timing the Market – Above chart simply shows how price action along with Time cycle and Neo wave can be combined. A Mentor can ensure that proper application of these methods is passed across so that it can form a powerful system to generate that parallel source of income. Be a part of Elite traders community we call as #TimeTraders. Fill below form for more details: